by Don Vialoux, Timing the Market
(Editor’s Note: Mr. Vialoux is scheduled to appear on BNN Television at 3:20 PM EDT)
Economic News This Week
May China PMI to be released on Sunday is expected to increase to 50.7 from 50.4 in May.
May ISM to be released at 10:00 AM EDT on Monday is expected to increase to 54.9 in April
April Construction Spending to be released at 10:00 AM EDT on Monday is expected to increase 0.7% versus a gain of 0.2% in March
April Factory Orders to be released at 10:00 AM EDT on Tuesday are expected to increase 0.5% versus a gain of 1.1% in March.
May ADP Private Employment Report to be released at 8:15 AM EDT on Wednesday are expected to dip to 200,000 from 220,000 in April.
April Trade Deficit to be released at 8:30 AM EDT on Wednesday is expected to increase to $41 billion from $40.4 billion in March.
April Canadian Merchandise Trade is expected to reach a $200 million deficit versus a $100 million surplus in March
Revised First Quarter Productivity to be released at 8:30 AM EDT on Wednesday is expected to fall 2.3% versus a previous estimated decline of 1.7%.
May ISM Services to be released at 10:00 AM EDT on Wednesday are expected to increase to 55.5 from 55.2 in April
The Fed Beige Book is scheduled to be released at 2:00 PM EDT on Wednesday
Bank of England Rate Decision is scheduled to be released at 7:00 PM EDT on Thursday
European Central Bank Rate Decision is scheduled to be released at 7:45 PM EDT on Thursday
Weekly Initial Jobless Claims to be released at 8:30 AM EDT on Thursday are expected to increase to 315,000 from 300,000 last week
May Non-farm Payrolls to be released at 8:30 AM EDT on Friday are expected to fall to 218,000 from 288,000 in April. May Private Non-farm Payrolls are expected to drop to 230,000 from 273,000 in April. May Unemployment Rate is expected to increase to 6.4% from 6.3% in April. May Hourly Earnings are expected to increase 0.2% versus no change in April.
May Canadian Employment to be released at 8:30 AM EDT on Friday is expected to add 21,300 jobs versus a 28,900 decline in April. The May Unemployment Rate is expected to remain unchanged at 6.9%
Earnings Reports This Week
Tuesday: Hudson’s Bay Company
Wednesday: Laurentian Bank
Equity Trends
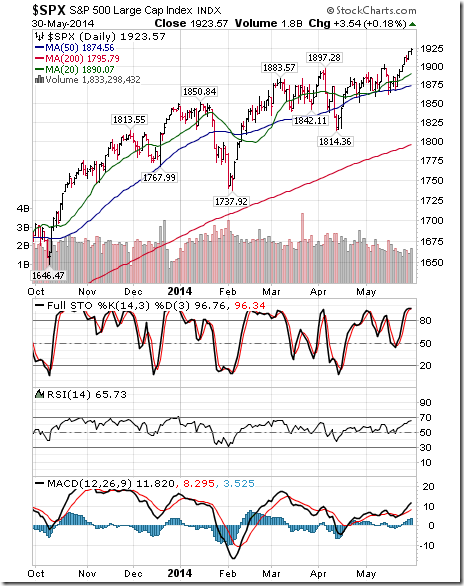
The S&P 500 Index added 23.04 points (1.21%) last week. Intermediate trend remains up. The Index closed an all-time high on Friday. The Index remains above its 20, 50 and 200 day moving averages. Short term momentum indicators are trending up, but are overbought.
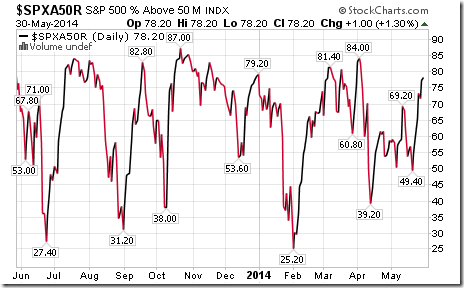
Percent of S&P 500 stocks trading above their 50 day moving average increased last week to 78.20% from 65.40%. Percent remains intermediate overbought.
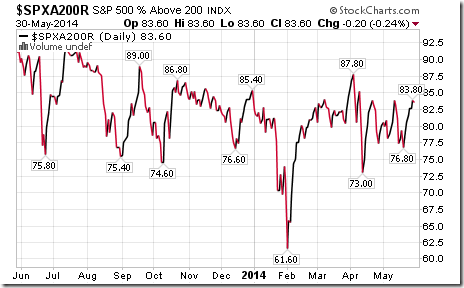
Percent of S&P 500 stocks trading above their 200 day moving average increased last week to 83.60% from 81.60%. Percent remains intermediate overbought.
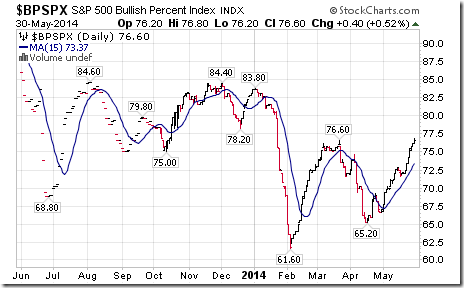
Bullish Percent Index for S&P 500 stocks increased last week to 76.60% from 74.20% and remains above its 15 day moving average. The Index remains intermediate overbought.
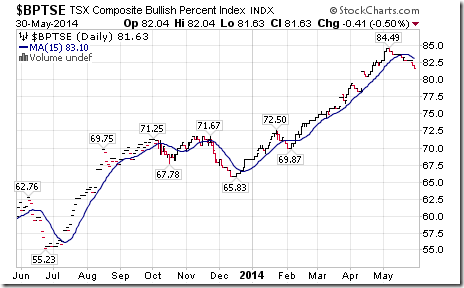
Bullish Percent Index for TSX Composite stocks fell last week to 81.63% from 82.86% and remained below its 15 day moving average. The Index remains intermediate overbought and trending down.
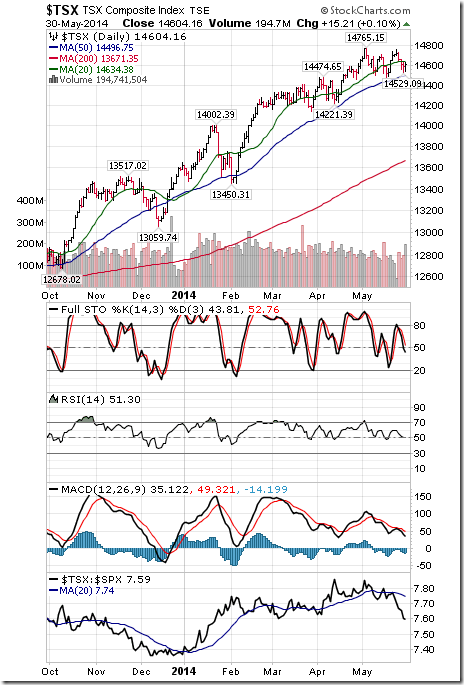
The TSX Composite Index fell 103.94 points (0.71%) last week. Intermediate trend remains up (Score: 1.0). The Index fell below its 20 day moving average (Score: 0.0. Strength relative to the S&P 500 Index remains negative (Score: 1.0. Technical score based on the above indicators fell to1.0 from 2.0 out of 3.0. Short term momentum indicators changed from mixed to down.
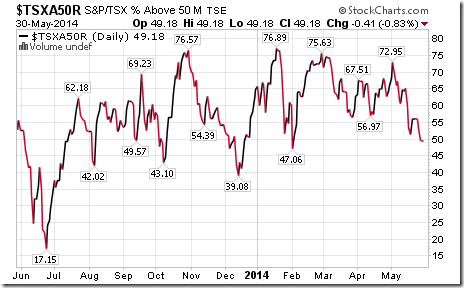
Percent of TSX stocks trading above their 50 day moving average fell last week to 49.18%. Percent is in an intermediate downtrend.
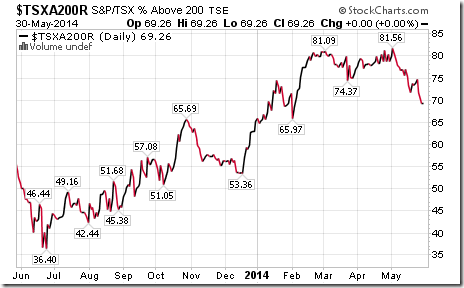
Percent of TSX stocks trading above their 200 day moving average dropped last week to 69.26% from 73.77%. Percent remains intermediate overbought and trending down.
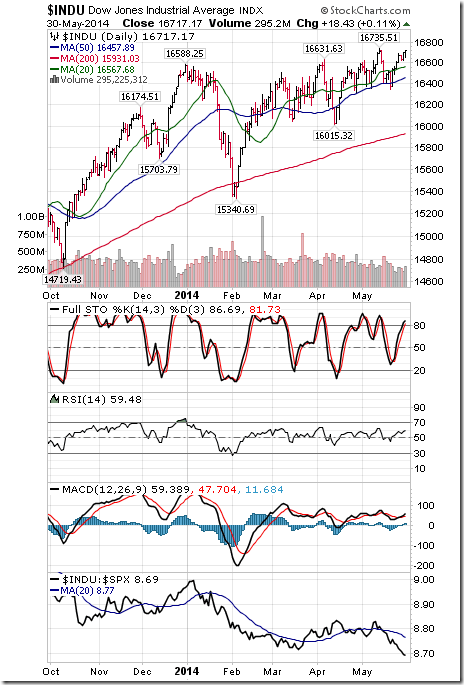
The Dow Jones Industrial Average gained 110.90 points (0.67%). Intermediate trend remains up. The Average closed at an all-time closing high on Friday. The Average remains above its 20 day moving average. Strength relative to the S&P 500 Index remains negative. Technical score remains at 2.0 out of 3.0. Short term momentum indicators are trending up, but are overbought.
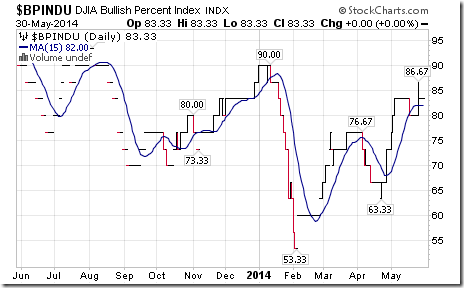
Bullish Percent Index for Dow Jones Industrial Average stocks increased last week to 83.33% from 80.00% and recovered back above its 15 day moving average. The Index remains intermediate overbought.
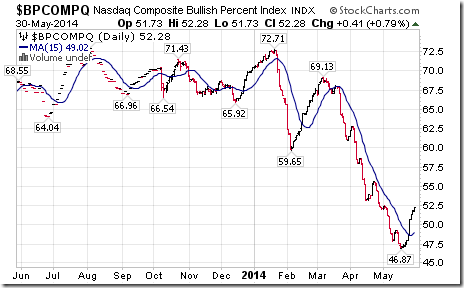
Bullish Percent Index for NASDAQ Composite stocks increased last week to 52.28% from 48.70% and moved above its 15 day moving average. The Index has returned to overbought levels.
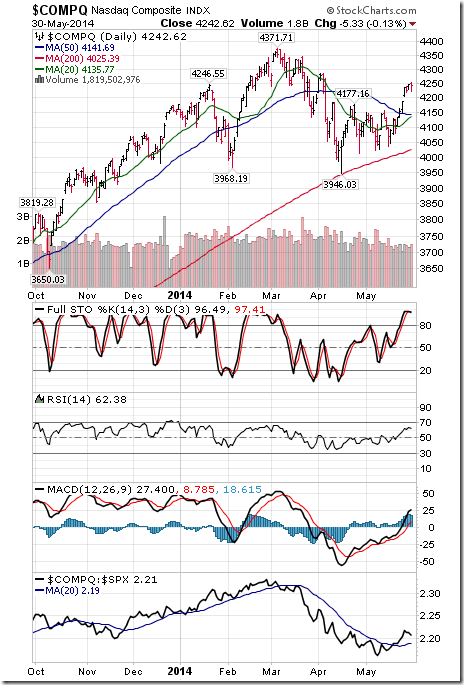
The NASDAQ Composite Index increased 56.81 points (1.36%) last week. Intermediate trend remains up. The Index remains above its 20 day moving average. Strength relative to the S&P 500 Index remains positive. Technical score remains at 3.0 out of 3.0. Short term momentum indicators are trending up, but are overbought.
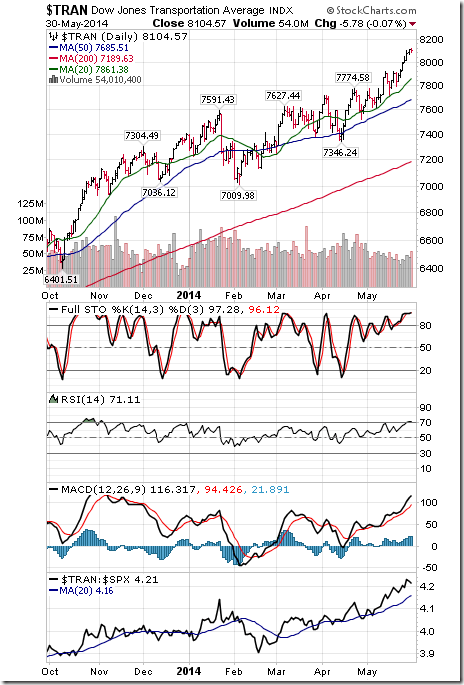
The Dow Jones Transportation Average added 117.99 points (1.48%) last week. Intermediate trend remains up. The Average touched at an all-time high on Friday. The Average remains above its 20 day moving average. Strength relative to the S&P 500 Index remains positive. Technical score remains at 3.0. Short term momentum indicators are trending up, but are overbought.
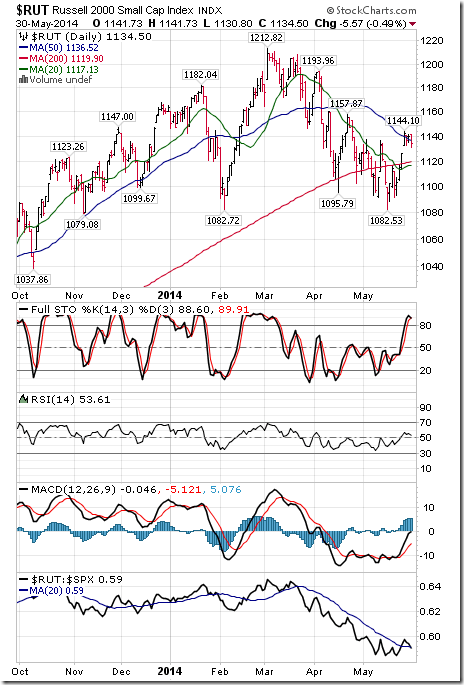
The Russell 2000 Index added 8.31 points (0.74%) last week. Intermediate trend remains down. The Index remains above its 20 day moving average. Strength relative to the S&P 500 Index remains neutral. Technical score remains at 1.5 out of 3.0. Short term momentum indicators are trending up, but are overbought.
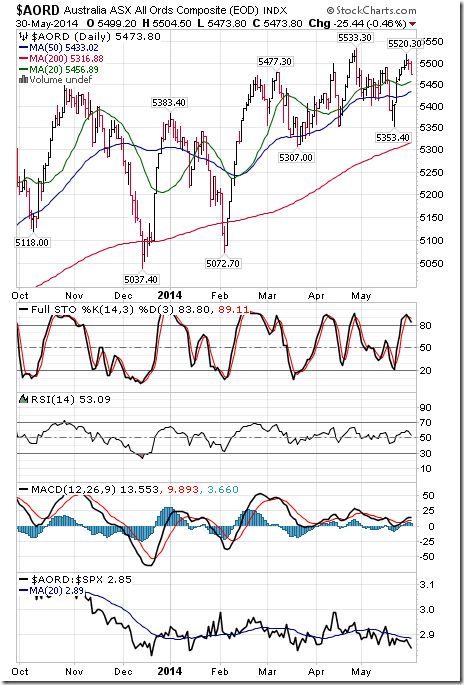
The Australia All Ordinaries Composite Index added 3.50 points (0.06%) last week. Intermediate trend improved from down to neutral on a move above 5,430.20. The Index remains above its 20 day moving average. Strength relative to the S&P 500 Index changed from neutral to negative. Technical score remains at 1.5 out of 3.0. Short term momentum indicators are trending up, but are overbought.
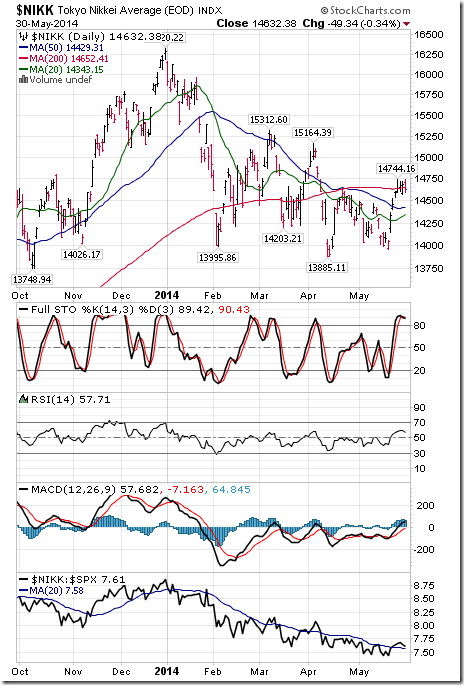
The Nikkei Average added 170.21 points (1.18%) last week. Intermediate trend changed from down to up on a move above 16,469.50. The Average remains above its 20 day moving average. Strength relative to the S&P 500 Index remains neutral. Technical score improved to 2.5 from 1.5 out of 3.0. Short term momentum indicators are trending up, but are overbought.
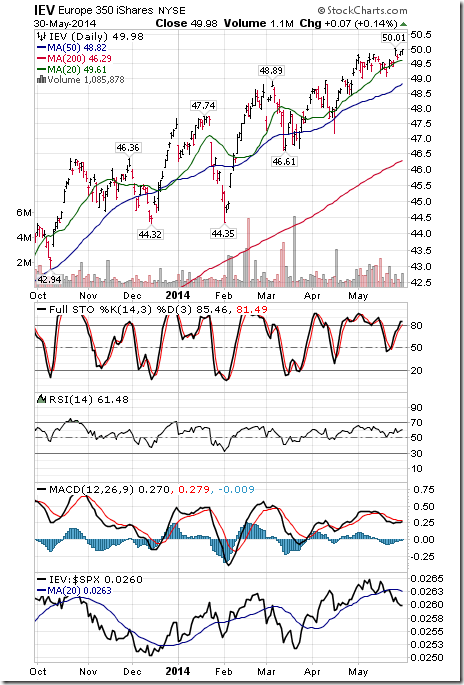
Europe 350 iShares added $0.45 (0.91%) last week. Intermediate trend remains up. Units remain above their 20 day moving average. Strength relative to the S&P 500 Index remains negative. Technical score remains at 2.0. Short term momentum indicators are trending up, but are overbought.
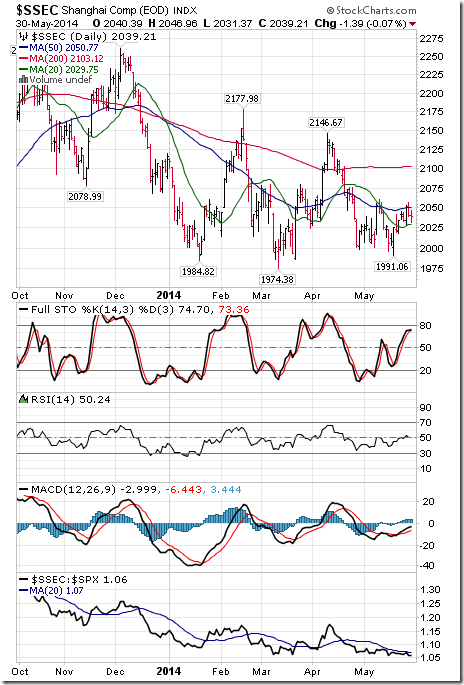
The Shanghai Composite Index added 4.64 points (0.23%) last week. Intermediate trend remains neutral. The Index remains above its 20 day moving average. Strength relative to the S&P 500 Index changed from neutral to negative. Technical score slipped to 1.5 from 2.0 out of 3.0. Short term momentum indicators are trending up.
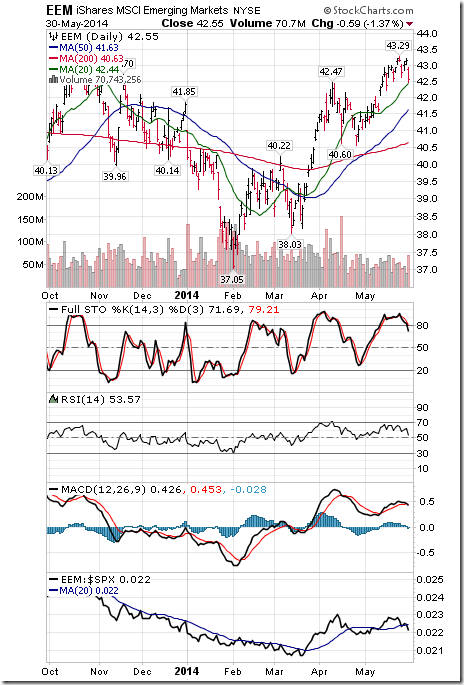
iShares Emerging Markets slipped $0.59 (1.37%) last week. Intermediate trend remains up. Units remain above their 20 day moving average. Strength relative to the S&P 500 Index changed from positive to negative. Technical score fell to 2.0 from 3.0 out of 3.0. Short term momentum indicators have rolled over from overbought levels.
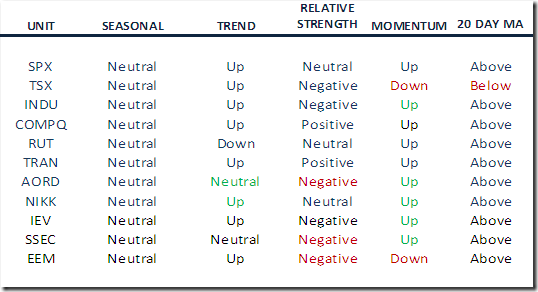
Summary of Weekly Seasonal/Technical Parameters for Equity Indices/ETFs
Key:
Seasonal: Positive, Negative or Neutral on a relative basis applying EquityClock.com charts
Trend: Up, Down or Neutral
Strength relative to the S&P 500 Index: Positive, Negative or Neutral
Momentum based on an average of Stochastics, RSI and MACD: Up, Down or Mixed
Twenty Day Moving Average: Above, Below
Green: Upgrade
Red: Downgrade
Currencies
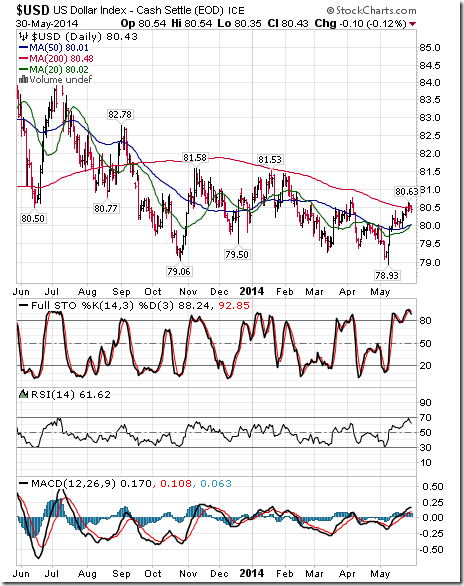
The U.S. Dollar was unchanged last week. Intermediate trend remains down. The Dollar remains above its 20 and 50 day moving averages. Short term momentum indicators are trending up, but are overbought and showing early signs of peaking.
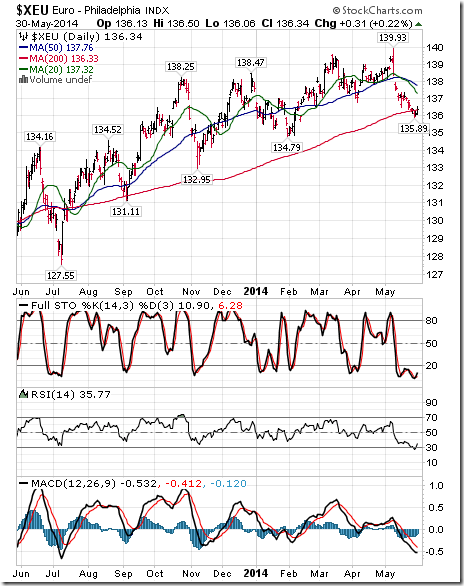
The Euro added 0.06 (0.44%) last week. Intermediate trend remains neutral. The Euro remains below its 20 and 50 day moving averages. Short term momentum indicators are trending down, but are oversold and showing early signs of bottoming.
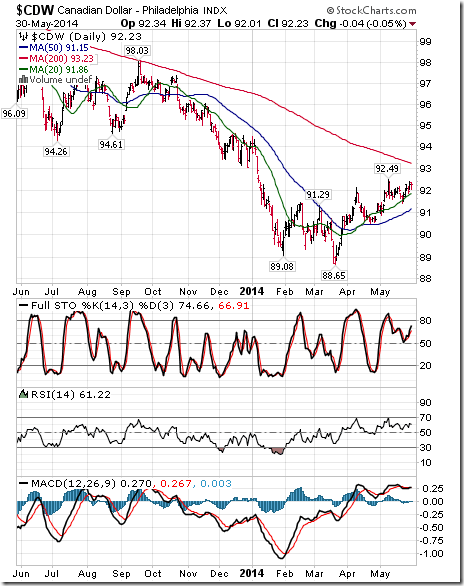
The Canadian Dollar added US 0.26 cents (2.83%) last week. Intermediate trend remains up. The Canuck Buck remains above its 20 day moving average. Short term momentum indicators are mixed.
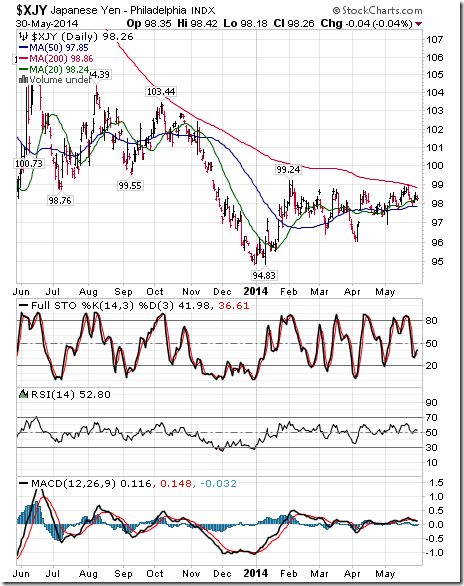
The Japanese Yen added 0.19 (1.94%) last week. Intermediate trend remains down. The Yen recovered to above its 20 day moving average. Short term momentum indicators are trending down.
Commodities
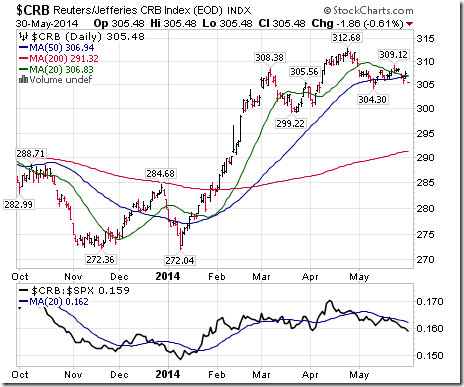
The CRB Index fell 2.15 points (0.70%) last week. Intermediate trend remains up. The Index remains below its 20 day moving average. Strength relative to the S&P 500 Index changed from neutral to negative. Technical score fell to 1.0 from 1.5 out of 3.0.
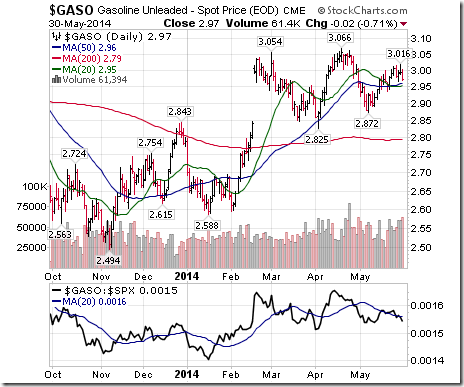
Gasoline fell $0.04 per gallon (1.33%) last week. Intermediate trend remains up. Gas remains above its 20 day moving average. Strength relative to the S&P 500 Index remains neutral. Technical score remains at 2.5 out of 3.0.
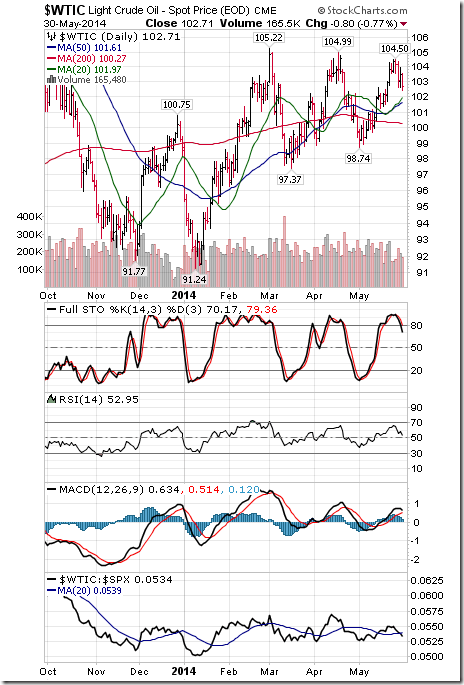
Crude Oil fell $1.64 per barrel (1.57%) last week. Intermediate trend remains neutral. Crude remains above its 20 day moving average. Strength relative to the S&P 500 Index changed from positive to neutral. Technical score slipped to 2.0 from 2.5 out of 3.0. Short term momentum indicators are overbought and are rolling over.
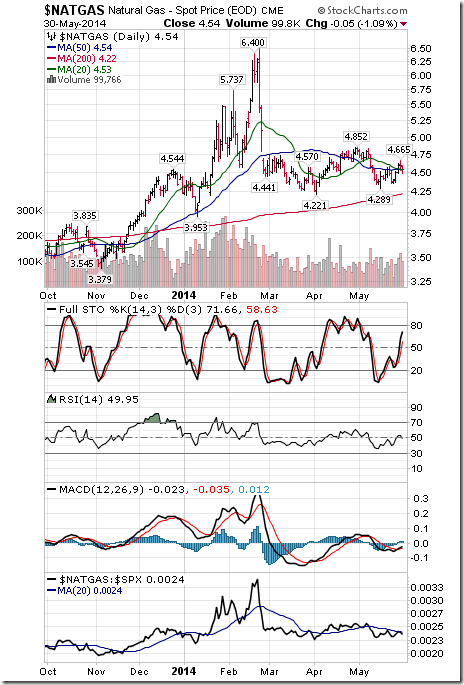
Natural gas added $0.13 per MBtu (2.95%) last week. Intermediate trend remains neutral. Gas moved above its 20 day moving average. Strength relative to the S&P 500 Index changed from negative to neutral. Technical score improved to 2.0 from 0.5 out of 3.0. Short term momentum indicators are trending up.
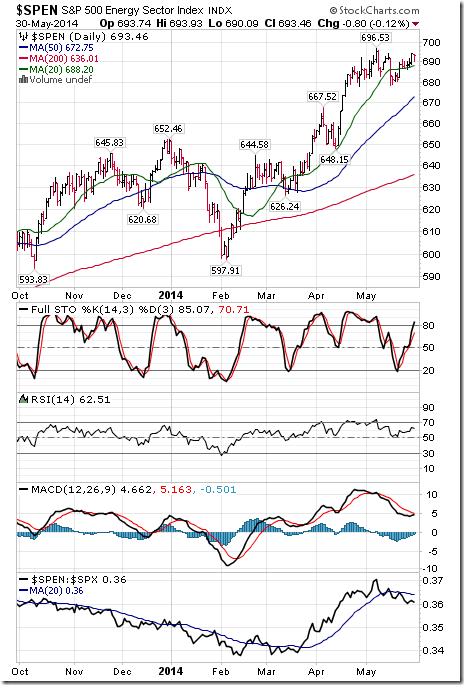
The S&P Energy Index added 6.65 points (0.96%) last week. Intermediate trend remains up. The Index moved above its 20 day moving average. Strength relative to the S&P 500 Index remains negative. Technical score increased to 2.0 from 1.0 out of 3.0. Short term momentum indicators are trending up.
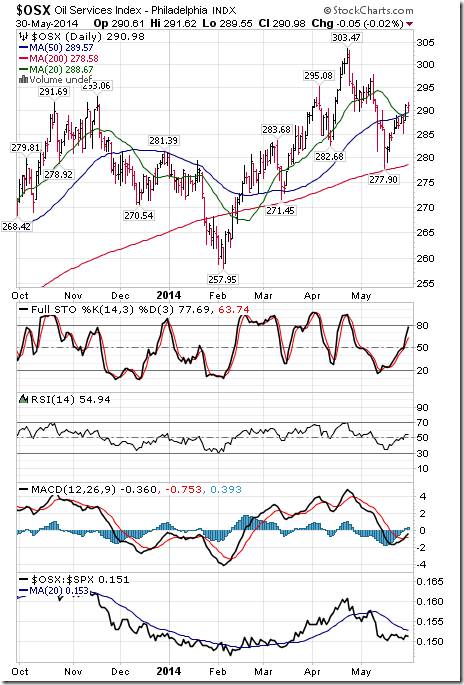
The Philadelphia Oil Services Index gained 4.88 points (1.71%) last week. Intermediate trend remains down. The Index moved above its 20 day moving average. Strength relative to the S&P 500 Index remains negative. Technical score improved to 1.0 from 0.0 out of 3.0. Short term momentum indicators are trending up.
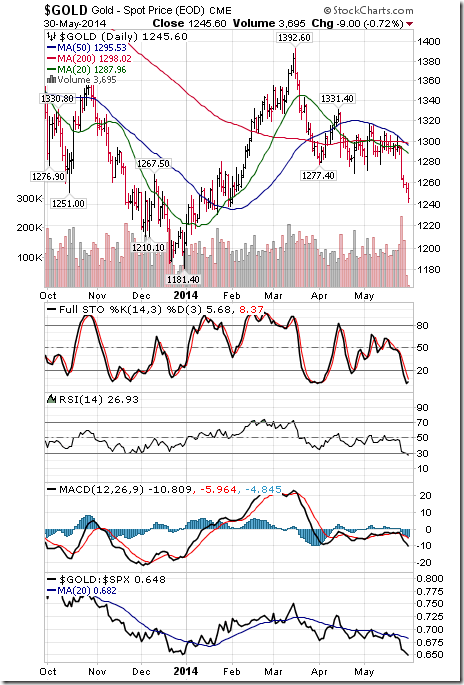
Gold plunged $46.10 per ounce (3.57%) last week. Intermediate trend remains down. Gold remains below its 20 day moving average. Strength relative to the S&P 500 Index changed from neutral to negative. Technical score fell to 0.0 from 0.5 out of 3.0. Short term momentum indicators are trending down, but are oversold.
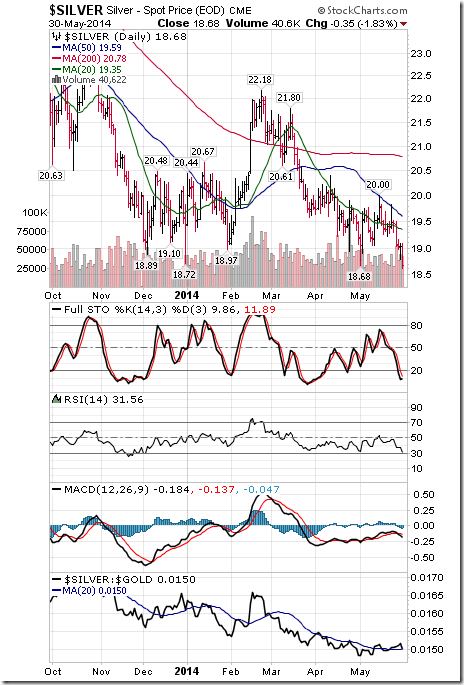
Silver dropped $0.74 per ounce (4.30%) last week. Intermediate downtrend was confirmed on Friday on a break below support at $18.68. Silver remains below its 20 day moving average. Strength relative to the S&P 500 Index and Gold changed from neutral to negative. Technical score fell to 0.0 from 0.5 out of 3.0. Short term momentum indicators are trending down, but are oversold.
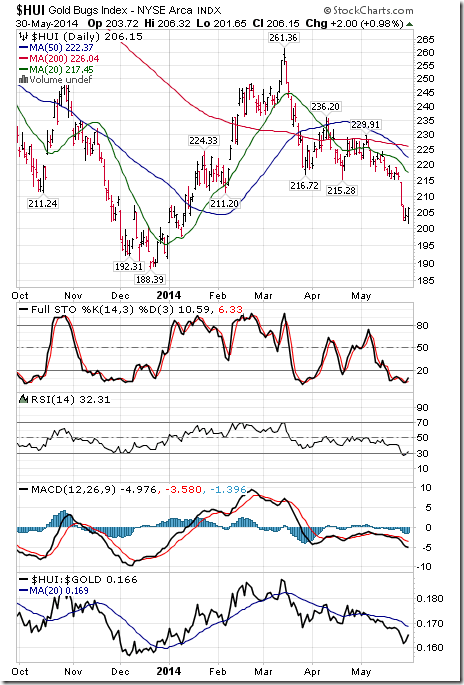
The AMEX Gold Bug Index dropped 9.98 points (4.62%) last week. Intermediate trend remains down. The Index remains below its 20 day moving average. Strength relative to the S&P 500 Index and Gold remains negative. Technical score remains at 0.0 out of 3.0. Short term momentum indicators are trending down, but are oversold and showing early signs of bottoming.
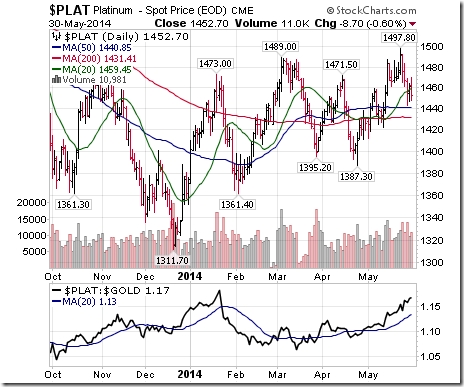
Platinum fell $20.10 per ounce (1.36%) last week. Intermediate trend remains up. Platinum fell below its 20 day moving average on Friday. Strength relative to the S&P 500 Index changed from positive to negative. Technical score fell to 1.0 from 3.0 out of 3.0.
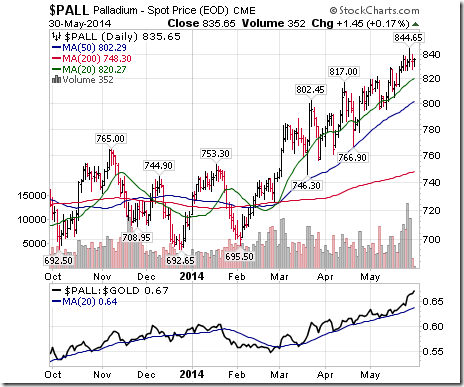
Palladium added $4.20 per ounce (0.51%) last week. Trend remains up. PALL remains above its 20 day MA. Strength relative to the S&P 500 Index and Gold remains positive.
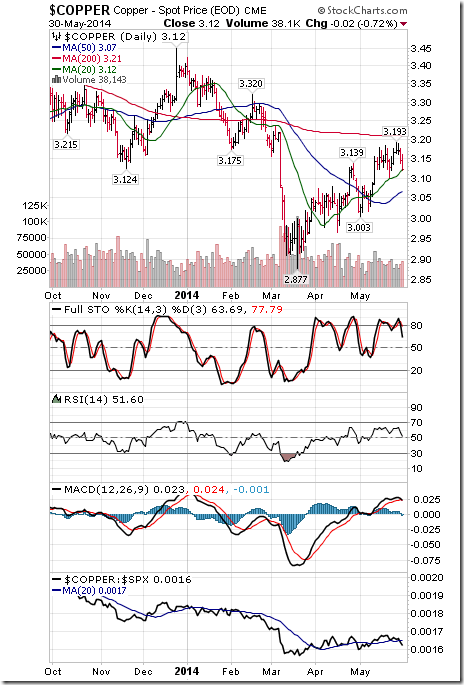
Copper slipped $0.05 per lb. (1.38%) last week. Intermediate trend remains up. Copper remains above its 20 day moving average. Strength relative to the S&P 500 Index changed from neutral to negative. Technical score slipped to 2.0 from 2.5 out of 3.0. Short term momentum indicators have rolled over from overbought levels.
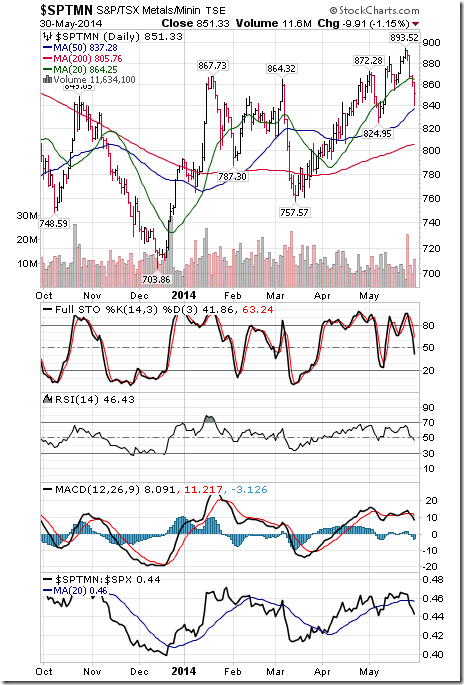
The TSX Metals & Mining Index fell 33.82 points (3.82%) last week. Intermediate trend remains up. The Index fell below its 20 day moving average. Strength relative to the S&P 500 Index changed from positive to negative. Technical score fell to 1.0 from 3.0 out of 3.0. Short term momentum indicators are trending down.
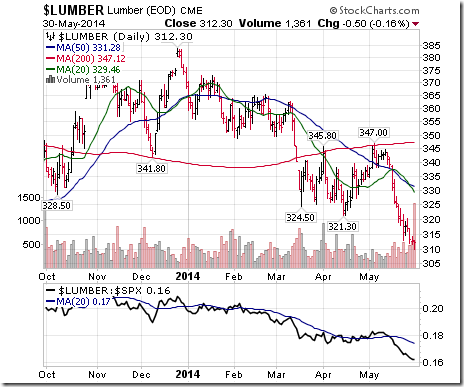
Lumber fell $5.00 (1.58%) last week. Trend remains down. Lumber remains below its 20 day MA. Strength relative to the S&P 500 Index remains negative.
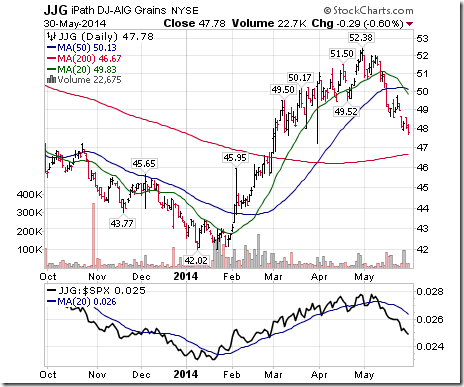
The Grain ETN fell $1.19 (2.44%) last week. Trend remains up. Units remain below their 20 day moving average. Strength relative to the S&P 500 Index remains negative. Technical score remains at 1.0 out of 3.0.
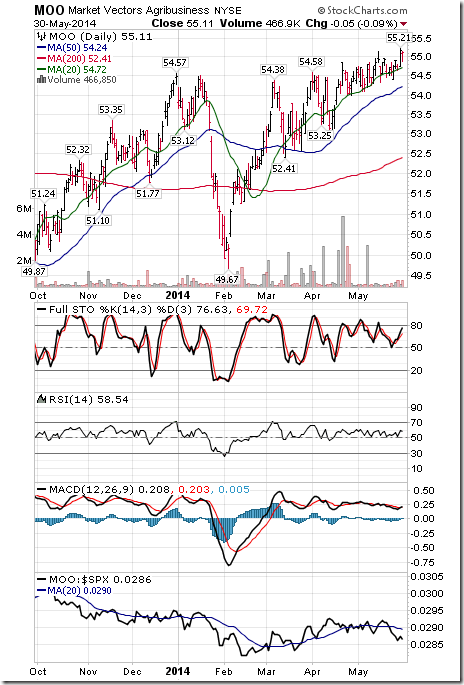
The Agriculture ETF gained $0.37 (0.68%) last week. Intermediate trend remains up. Units remain above their 20 day moving average. Strength relative to the S&P 500 Index changed from neutral to negative. Technical score slipped to 2.0 from 2.5 out of 3.0. Short term momentum indicators are mixed.
Interest Rates
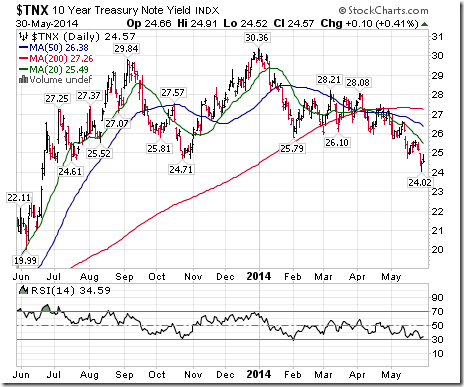
The yield on 10 year Treasuries dropped 7.8 basis points (3.08%) last week. Intermediate trend remains down. Yield remains below its 20 day moving average. Short term momentum indicators are trending down, but are oversold.
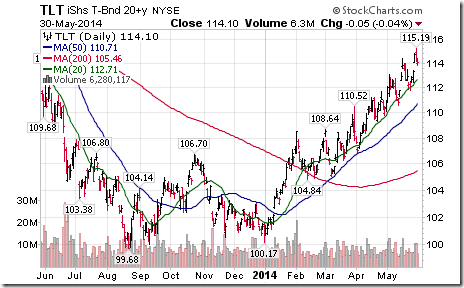
Conversely, price of the long term Treasury ETF gained $1.40 (1.24%) last week. Intermediate trend remains up. Units remain above their 20 day moving average.
Other Issues
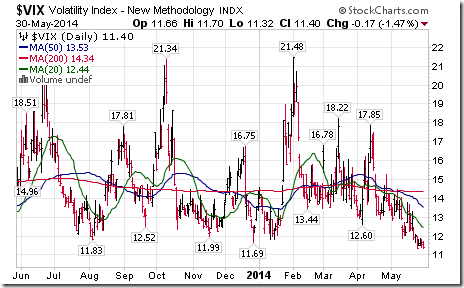
The VIX Index added 0.04 (0.35%) last week. The Index remains at a multi-year low.
Earnings reports released this week are not market movers
Economic focuses this week are on the ISM reports, U.S. Trade Deficit and the May employment report. Reports from previous monthly reports probably were inflated. Don’t be surprised if economic data disappoints
International focus is on European Central Bank announcement on Thursday where additional monetary stimulus through lower administered rates is anticipated.
The Memorial Day Holiday trade was a success this year. The trade officially ends on Wednesday.
Performance by major North American equity indices in the month of June has not been good relative to performance in other months in the year. June has been the second worst performing month for the S&P 500 Index and the Dow Jones Industrial Average during the past 63 years and the second worst performing month for the TSX Composite Index during the past 48 years. The worst month for all major North American equity performance is September. Performance has been particularly cruel during the past 10 years. On average, the Dow Jones Industrial Average fell 1.4 per cent per period, the S&P 500 Index dropped 1.3 per cent, the NASDAQ Composite Index gave up 1.0 per cent and the TSX Composite Index lost 1.0 per cent.
Sectors most impacted in June were economic sensitive sectors. Data for the past 23 periods shows the weakest sectors in order of significance were Materials, Financials, Consumer Discretionary and Industrials. All fell by 1.0 per cent per period or more in the month. Only one sector recorded gains: Health Care.
Selected economic sensitive sectors have started to roll over. The TSX Metals & Mining Index fell 3.8% last week. The Steel ETF has dropped 3.3% during the past two weeks.
Short term and intermediate technical indicators are overbought, but most have yet to show signs of peaking.
The Bottom Line
Except the S&P 500 Index and the Dow Jones Transportation Average, equity markets around the world have ended their annual period of seasonal strength. Equity markets recently have entered into a period of higher than average volatility and lower returns from the first week in May to the last week in October. Strength if occurring is an opportunity to take profits, particularly in economic sensitive sectors.
Special Free Services available through www.equityclock.com
Equityclock.com is offering free access to a data base showing seasonal studies on individual stocks and sectors. The data base holds seasonality studies on over 1000 big and moderate cap securities and indices. To login, simply go to http://www.equityclock.com/charts/
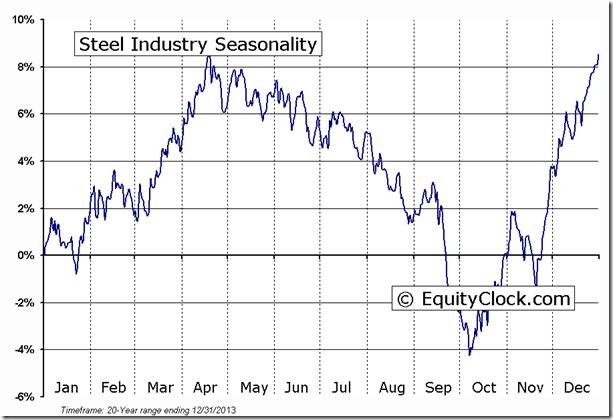
Following is an example:
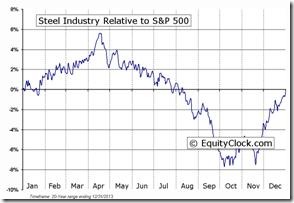
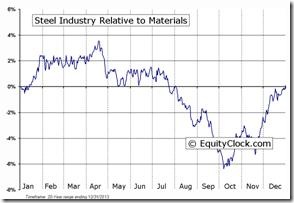
Steel Industry Seasonal Chart
Stock Twits Released on Friday
Technical action by S&P 500 stocks remains +ve. 18 stocks broke resistance and 2 broke support this morning. Tech and Staples led breakouts
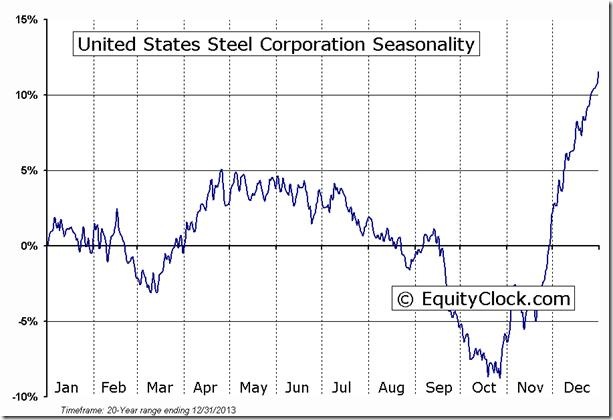
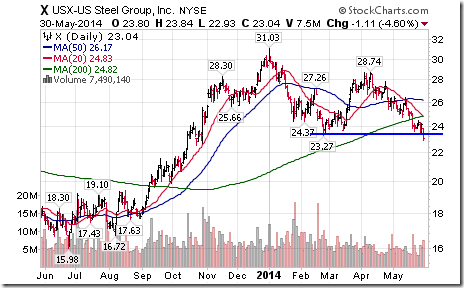
Notably weaker are steel stocks. U.S. Steel broke support. Seasonal influences are turning negative.
Disclaimer: Comments, charts and opinions offered in this report by www.timingthemarket.ca and www.equityclock.com are for information only. They should not be considered as advice to purchase or to sell mentioned securities. Data offered in this report is believed to be accurate, but is not guaranteed. Don and Jon Vialoux are Research Analysts with Horizons ETFs Management (Canada) Inc. All of the views expressed herein are the personal views of the authors and are not necessarily the views of Horizons ETFs Management (Canada) Inc., although any of the recommendations found herein may be reflected in positions or transactions in the various client portfolios managed by Horizons ETFs Management (Canada) Inc.
Horizons Seasonal Rotation ETF HAC May 30th 2014
Copyright © Don Vialoux, Jon Vialoux, Brooke Thackray


