Whenever you talk about which sectors of the market are working, market cap is one aspect that is usually overlooked. In the charts below, we highlight the relative strength of each S&P sector compared to its corresponding index across all three market cap levels (S&P 500 large cap, S&P 400 mid cap and S&P 600 small cap). For example, in the Consumer Discretionary sector we compare the performance of small cap Consumer Discretionary stocks to the S&P 600 Small Cap Index. Rising lines indicate that the sector is outperforming its index while a falling line indicates that the sector is underperforming. As you will see in the charts, normally the sector's relative strength moves in the same direction across all three market cap levels, but there are times when they diverge, and these divergences can be a sign that a turn is coming.
The peak period of relative performance for the Consumer Discretionary sector came right at the end of 2013, and since then it has been painful for investors who are overweight the sector. While no market cap range of the sector has been spared, large cap stocks in the sector have been hit especially hard and are right near their lows for the year. Ironically, the one area of the sector that has been showing signs of stabilization over the last several weeks has been small caps, even as small caps as a whole have been doing poorly.
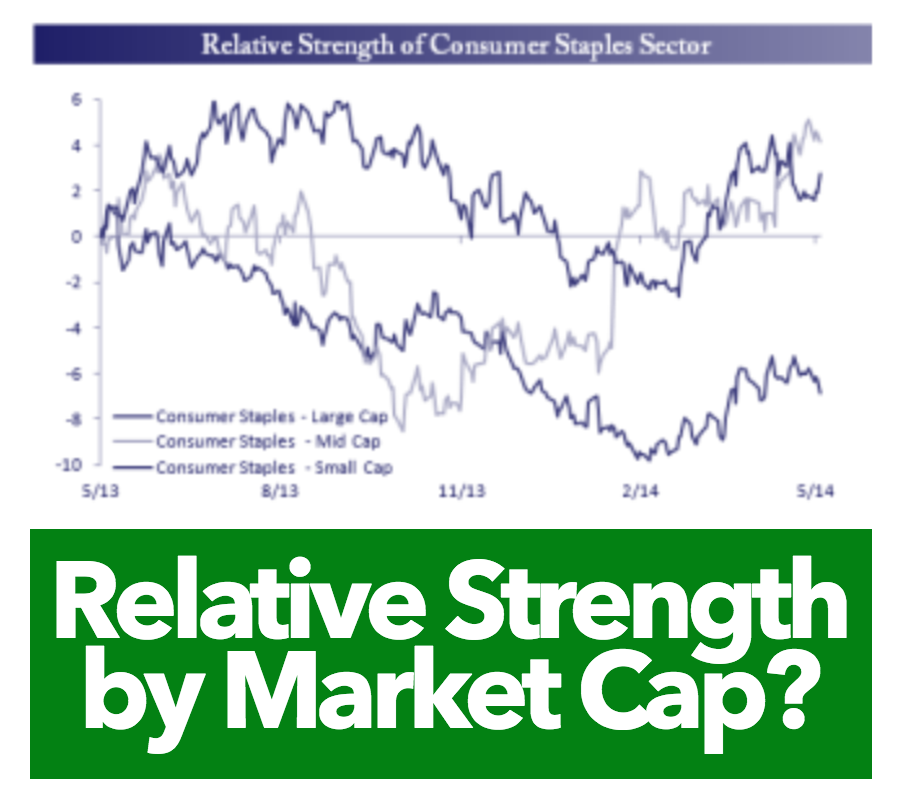
In the Consumer Staples sector, the disparity in the performance between large caps relative to mid and small caps is even wider. While large cap stocks in the sector have underperformed the S&P 500 by a wide margin, small and mid cap stocks in the sector are outperforming their peer indices over the last year.
One of the biggest variables that impacts consumer spending is energy prices. What's good for energy companies (higher energy prices) is bad for consumer stocks and vice versa. This can clearly be seen in the relative strength chart of the Energy sector. As the Consumer Discretionary sector chart above shows, just as that sector's relative strength peaked, the relative strength for the Energy sector troughed and has been steadily improving ever since. Both large and small cap stocks in the sector are at their highest levels of relative strength in the last year, while mid caps are not far behind.
It has been an ugly year for the Financial sector. In all three market cap ranges, stocks in the sector are underperforming their peer indices, and for all three, relative strength is at or near a 52-week low. While stocks of all size are underperforming, large caps have been holding up the best, and as we have noted numerous times in the past, that is due in large part to the regulatory environment for the sector which tends to put the largest companies in the sector at an advantage relative to smaller rivals.
Led in part by the surge in biotech stocks in 2013 and early 2014, Health Care sector stocks were solid outperformers. In late February/early March, though, the sector hit a speed bump, and saw a two month period of underperformance. Just as biotech stocks led the sector on the way up, they also led the sector lower. In the last several weeks, though, the sector has been getting back on track. Small cap Health Care sector stocks were the first to bottom out. Shortly thereafter, mid and large cap stocks in the sector followed suit. At their highs as well as their lows, it was the small cap Health Care sector stocks that led the rest of the sector, so that will be a key area to watch going forward.
Just like the Health Care sector, Industrial sector stocks were strong outperformers for most of 2013. In 2014, however, the sector's relative strength has practically flat-lined. For both mid and large cap stocks in the sector, relative strength versus their peer indices is right near levels they were at to start the year. Small caps, however, have not been holding up quite as well and are underperforming since the start of the year.
Like the Energy sector, relative strength in the Materials sector has been positive for most of the year. After bottoming out on a relative basis in late 2013, the sector has been showing solid outperformance, although we would point out that mid cap Materials sector stocks have been underperforming in recent weeks.
The Technology sector has had its ups and downs over the last year. Through the summer and early fall of 2013, mid and large cap stocks in the sector outperformed, while large caps were range-bound relative to the S&P 500. Then, later in the fall of 2013, the mid and small caps faltered, while large caps remained steady. From there the sector outperformed across all three market cap ranges right up until February of this year, when they corrected along with the Health Care sector. Across all three market cap ranges, large caps have been the most stable, while mid and small cap stocks have been a lot more volatile.
In spite of their attractive dividend yields, both Telecom Services and Utilities have been out of favor for much of the last year. Outside of a month or two beginning in March when Utilities outperformed, these two defensive sectors have not been a source of strength.
Copyright © Bespoke Investment Group