by Don Vialoux, Timing the Market
Horizons Simulated Trading Competition Using ETFs
Horizons launches its simulated trading competition using ETFs on May 20th. Everyone is welcome. Cost to participants is zero. Should be fun! Cash prize is $13,000. Following is a link giving more details and a connection to register:
http://thebiggestwinner.stocktrak.com/home.aspx
Contest starts today!
Economic News This Week
FOMC Meeting Minutes from the April 29-30th meeting are released at 2:00 PM EDT on Wednesday
Weekly Initial Jobless Claims to be released at 8:30 AM EDT on Thursday are expected to increase to 305,000 from 297,000 last week.
Canadian April Consumer Prices to be released at 8:30 AM EDT on Friday are expected to increase 0.3% versus a gain of 0.6% in March.
April Existing Home Sales to be released at 10:00 AM EDT on Thursday are expected to increase to 468,000 units from 459,000 units in March
April Leading Economic Indicators to be released at 10:00 AM EDT on Thursday are expected to increase 0.5% versus a gain of 0.8% in March.
Canadian March Retail Sales to be released at 8:30 AM EDT on Thursday are expected to increase 0.2% versus a gain of 0.5% in February.
April New Home Sales to be released at 10:00 AM EDT on Friday are expected to increase to 415,000 from 384,000 in March.
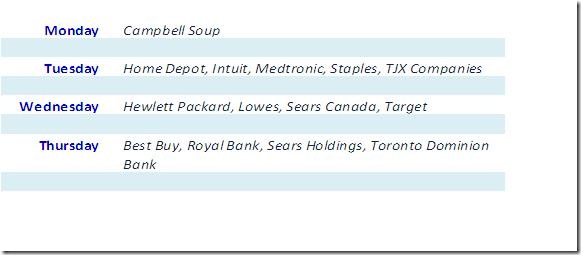
Earnings News This Week
Equity Trends
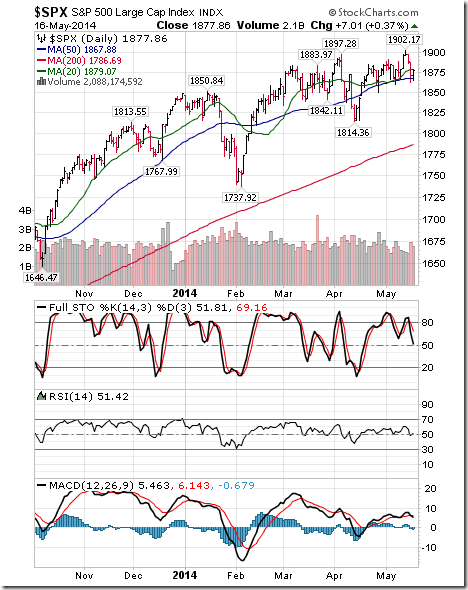
The S&P 500 Index dipped 0.62 (0.03%) last week. Intermediate trend changed from neutral to up on a move above 1,897.28. The Index fell below its 20 day moving average. Short term momentum indicators are trending down.
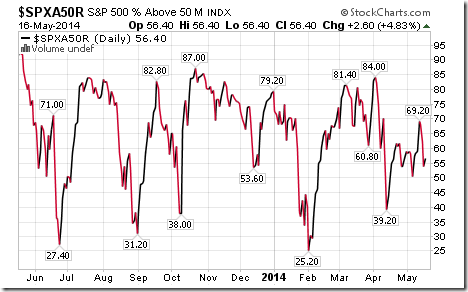
Percent of S&P 500 stocks trading above their 50 day moving average slipped last week to 56.40% from 59.00%. Percent remains intermediate overbought and is trending down.
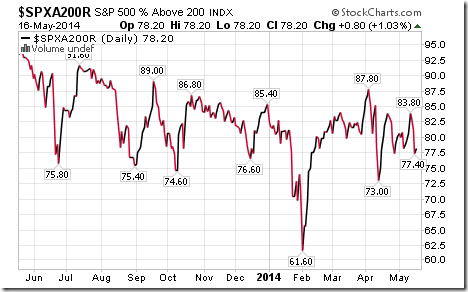
Percent of S&P 500 stocks trading above their 200 day moving average slipped to 78.20% from 80.60%. Percent remains intermediate trend.
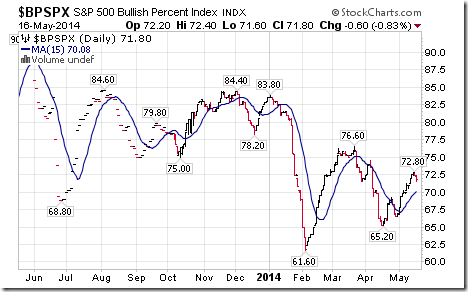
Bullish Percent Index for S&P 500 securities increased last week to 71.80% from 71.00% and remains above their 15 day moving average. The Index remains intermediate overbought.
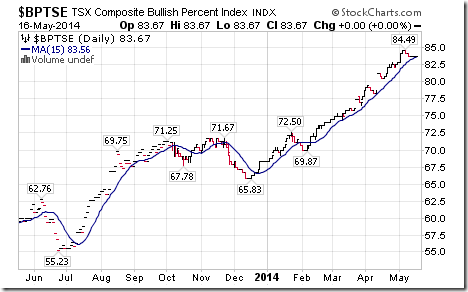
Bullish Percent Index for TSX stocks was unchanged last week at 83.67% and remains above its 15 day moving average. The Index remains intermediate overbought.
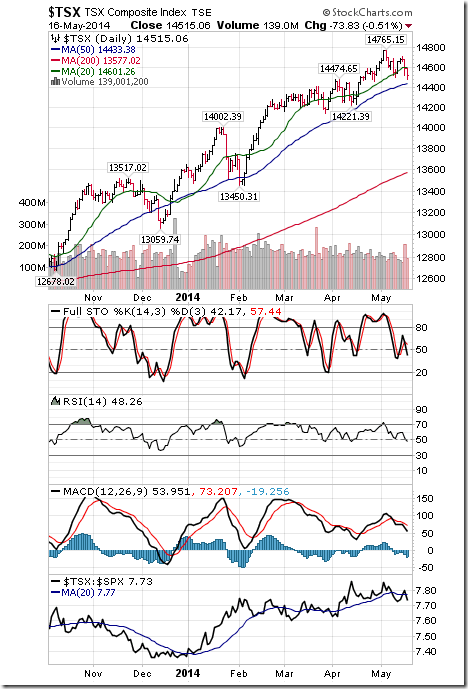
The TSX Composite Index slipped 19 points (0.13%) last week. Intermediate trend remains up (Score: 1.0). The Index fell below its 20 day moving average (Score: 0.0). Strength relative to the S&P 500 Index remains negative (Score: 1.0). Technical score remains at 1.0 out of 3.0. Short term momentum indicators are trending down.
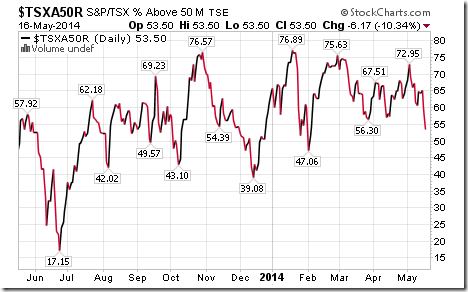
Percent of TSX stocks trading above their 50 day moving average fell last week to 53.50% from 60.66%. Percent remains intermediate overbought and trending down.
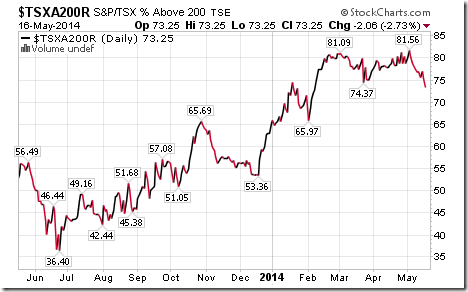
Percent of TSX stocks trading above their 200 day moving average dropped last week to 73.25% from 76.64%. Percent remains intermediate overbought and trending down.
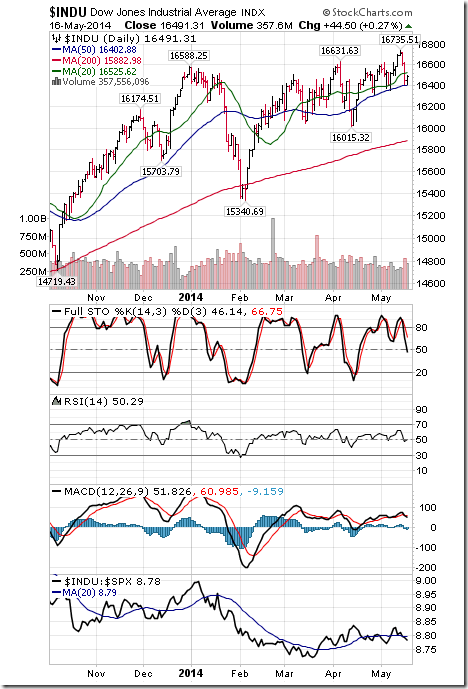
The Dow Jones Industrial Average lost 92.03 points (0.55%) last week. Intermediate trend changed from neutral to up on a move above 16,631.63. The Average fell below its 20 day moving average. Strength relative to the S&P 500 Index remains neutral. Technical score slipped to 1.5 from 2.0 out of 3.0. Short term momentum indicators are trending down.
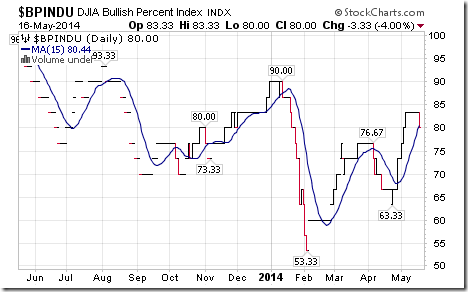
Bullish Percent Index for Dow Jones Industrial Average stocks slipped to 80.00% from 83.33% and fell below its 15 day moving average. The Index remains intermediate overbought.
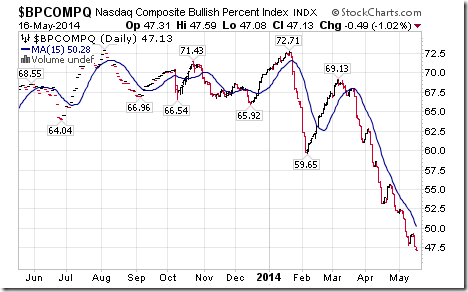
Bullish Percent Index for NASDAQ Composite stocks fell to 47.13% from 48.14% and remains below its 15 day moving average. The Index continues to trend down.
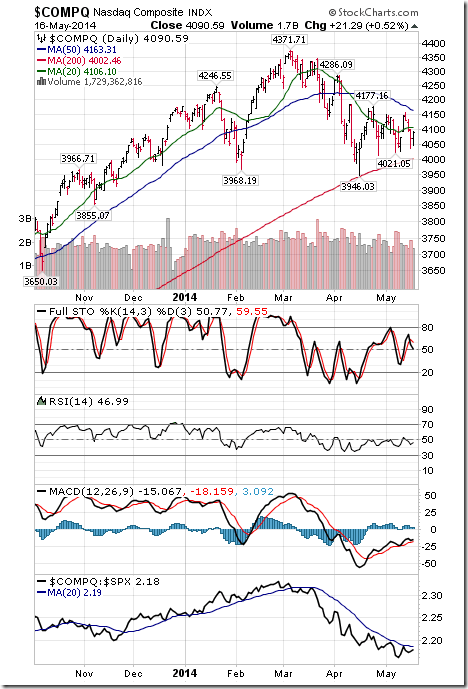
The NASDAQ Composite Index added 18.72 points (0.46%) last week. Intermediate trend remains down. The Index remains below its 20 day moving averages. Strength relative to the S&P 500 Index remains negative. Technical score remains at 0.0 out of 3.0. Short term momentum indicators are mixed
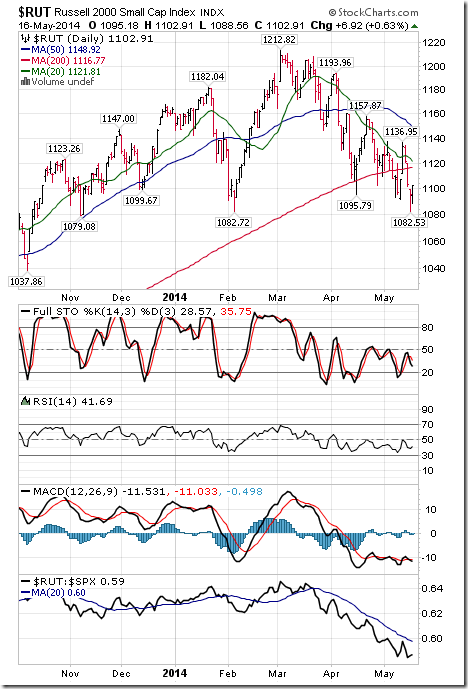
The Russell 2000 Index dropped 4.31 points (0.39%) last week. Intermediate trend remains down. The Index remains below its 20 day moving average. Strength relative to the S&P 500 Index remains negative. Technical score remains at 0.0 out of 3.0. Short term momentum indicators are oversold.
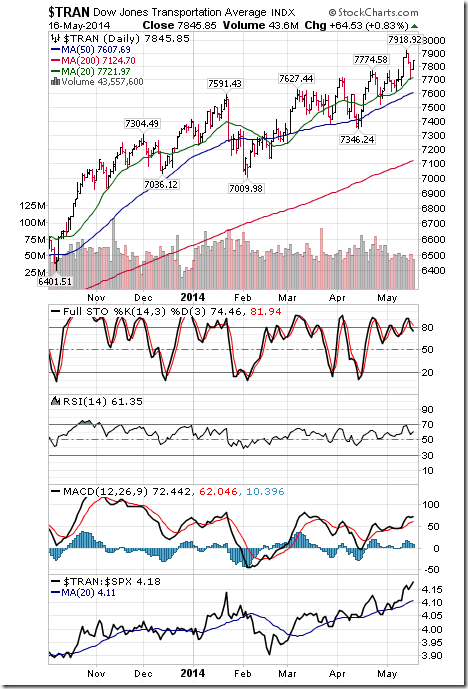
The Dow Jones Transportation Average added 126.55 points (1.64%) last week. Intermediate trend remains up. The Average remains above its 20 day moving average. Strength relative to the S&P 500 Index remains positive. Technical score remains at 3.0 out of 3.0. Short term momentum indicators are overbought.
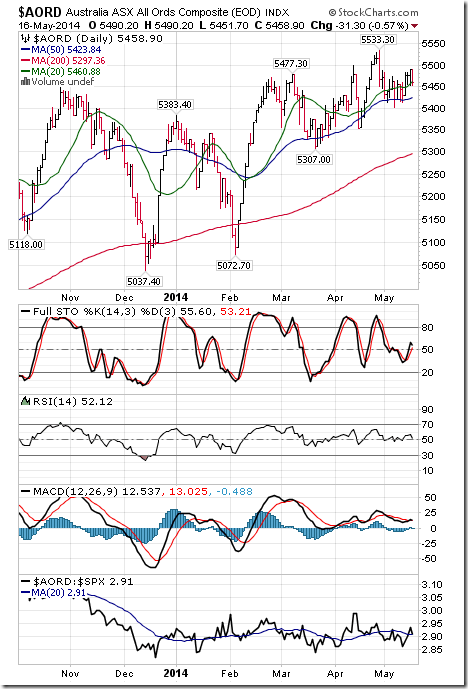
The Australia All Ordinaries Composite Index added 16.90 points (0.31%) last week. Intermediate trend is up. The Index remains below its 20 day moving average. Strength relative to the S&P 500 Index improved from negative to neutral. Technical score improved to 1.5 from 1.0 out of 3.0. Short term momentum indicators are mixed.
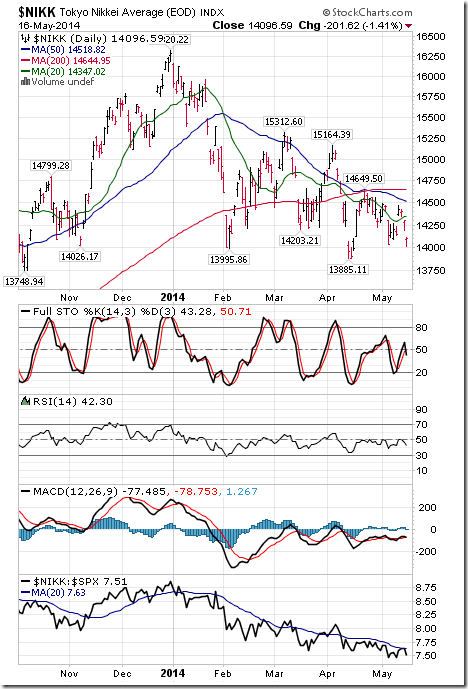
The Nikkei Average fell 103.00 points (0.73%) last week. Intermediate trend remains down. The Average remains below its 20 day moving average. Strength relative to the S&P 500 Index remains negative. Technical score remains at 0.0 out of 3.0. Short term momentum indicators are mixed.
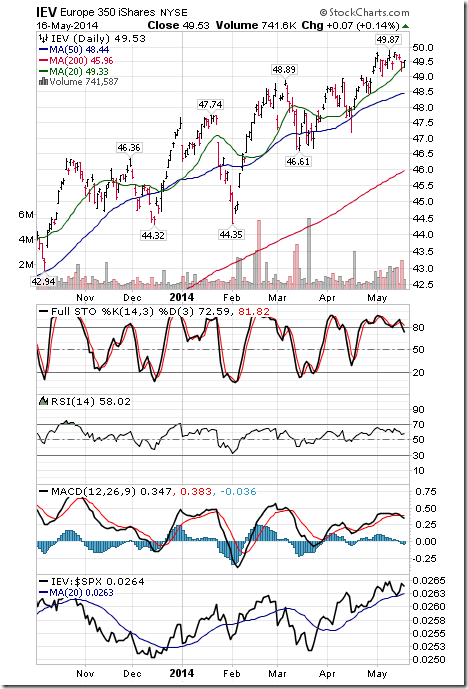
Europe 350 iShares added $0.10 (0.20%) last week. Intermediate trend remains up. Units remain above their 20 day moving average. Strength relative to the S&P 500 Index remains positive. Technical score remains at 3.0 out of 3.0. Short term momentum indicators are overbought and rolling over.
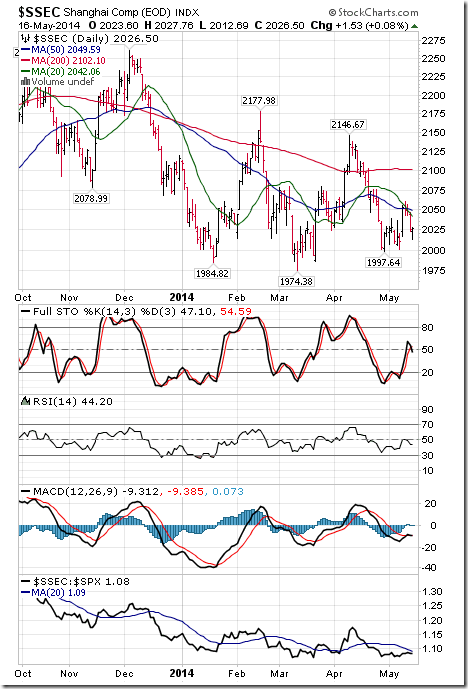
The Shanghai Composite Index added 15.37 points (0.76%) last week. Intermediate trend remains neutral. The Index remains below its 20 day moving average. Strength relative to the S&P 500 Index changed from negative to neutral. Technical score improved to 1.0 from 0.5 out of 3.0. Short term momentum indicators are mixed.
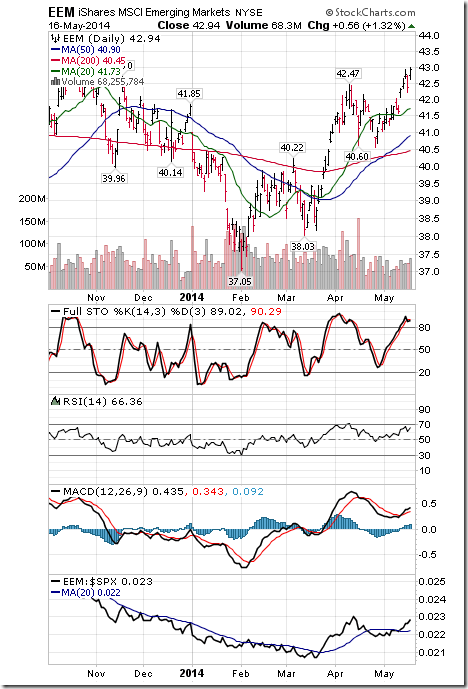
iShares Emerging Markets added $1.32 (0.32%) last week. Intermediate trend remains up. Units remain above their 20 day moving average. Strength relative to the S&P 500 Index changed from neutral to positive. Technical score improved to 3.0 from 2.5 out of 3.0. Short term momentum indicators are trending up.
Currencies
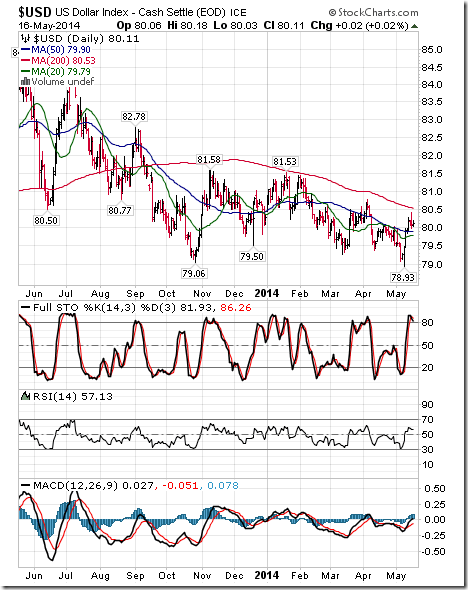
The U.S. Dollar Index added 0.18 (0.23%) last week. Intermediate trend remains negative. The Index remains above its 20 day moving average. Short term momentum indicators are trending up, but are overbought.
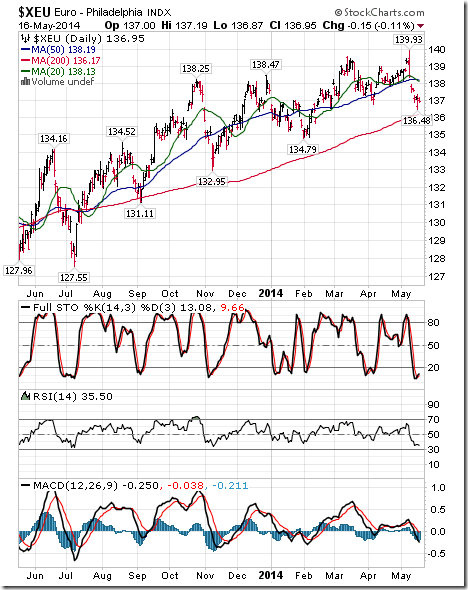
The Euro fell 0.75 (0.54%) last week. Intermediate trend changed from up to neutral on a move below 136.73. The Euro remains below its 20 day moving average. Strength relative to the S&P 500 Index are trending down, but are oversold.
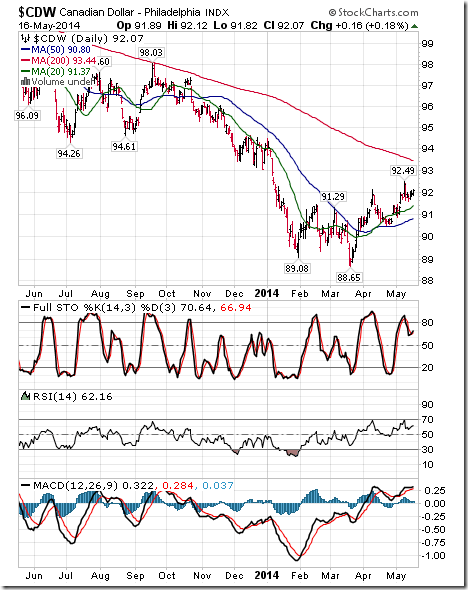
The Canadian Dollar added US 0.34 cents (0.37%) last week. Intermediate trend remains up. The Dollar remains above its 20 day moving average. Short term momentum indicators are trending up but are overbought.
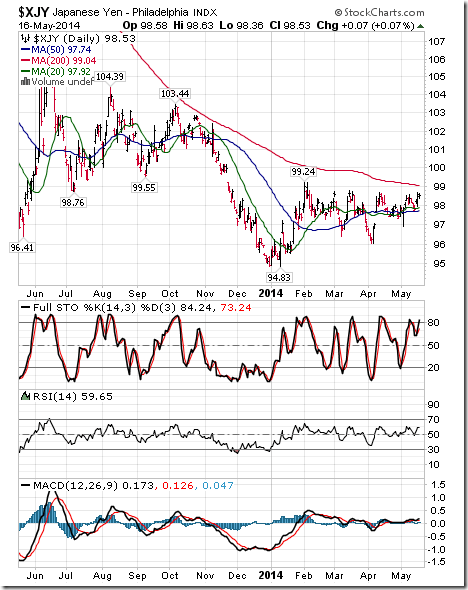
The Japanese Yen added 0.36 (0.37%) last week. Intermediate trend remains down. The Yen remains above its 20 day moving average. Short term momentum indicators are trending up, but are overbought.
Commodities
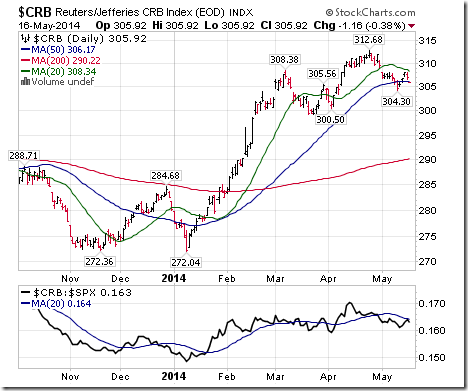
The CRB Index added 1.35 points (0.44%) last week. Intermediate trend remains up. The Index remains below its 20 day moving average. Strength relative to the S&P 500 Index changed from negative to neutral. Technical score improved to 1.5 from 1.0 out of 3.0.
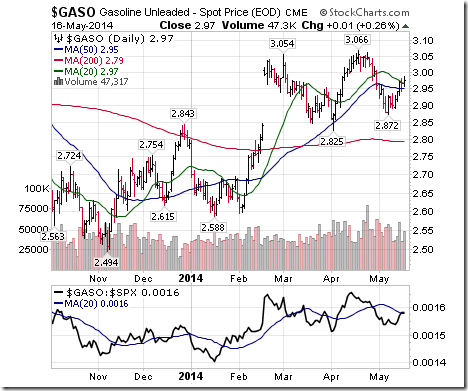
Gasoline added $0.07 per gallon (2.41%) last week. Intermediate trend remains up. Gasoline moved above its 20 day moving average. Strength relative to the S&P 500 Index improved from negative to neutral. Technical score improved to 2.5 from 1.0 out of 3.0.
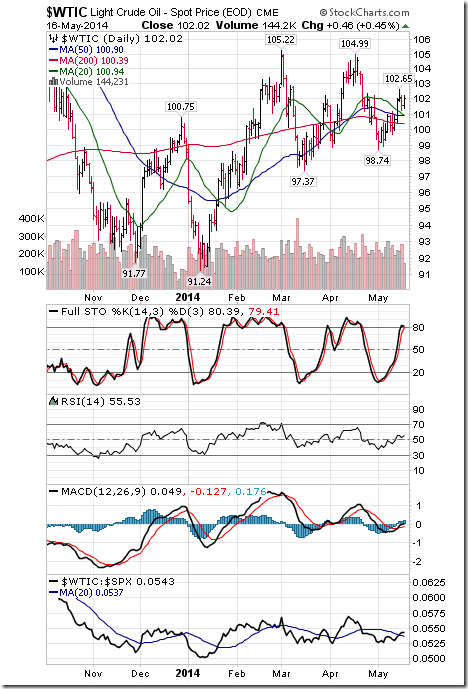
Crude oil added $1.95 per ounce (1.95%) last week. Intermediate trend remains neutral. Crude oil moved above its 20 day moving average. Strength relative to the S&P 500 Index changed from negative to positive. Technical score improved to 2.5 from 0.5 out of 3.0. Short term momentum indicators are trending up.
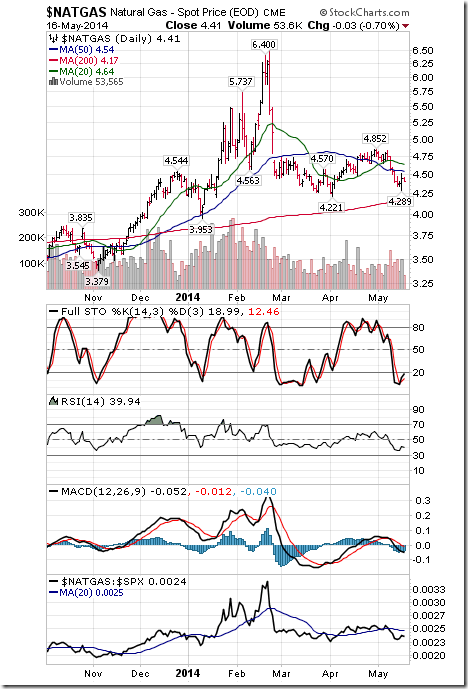
Natural Gas fell $0.12 per MBtu (2.65%) last week. Intermediate trend remains neutral. Gas remains below its 20 day moving average. Strength relative to the S&P 500 Index changed from neutral to negative. Short term momentum indicators are trending down.
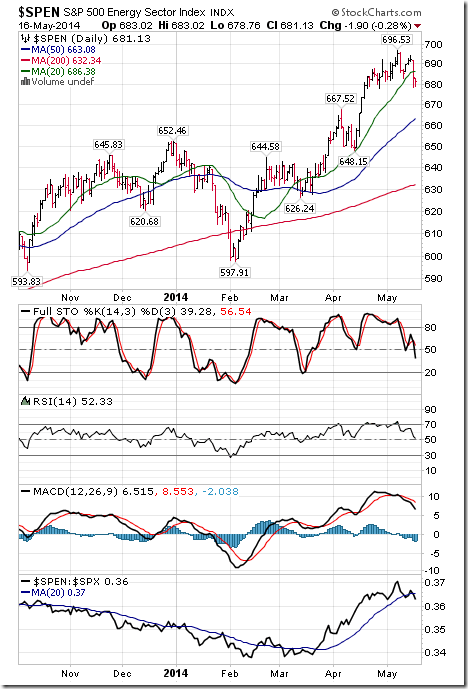
The S&P Energy Index fell 4.22 points (0.62%) last week. Intermediate trend remains up. The Index fell below its 20 day moving average. Strength relative to the S&P 500 Index changed from neutral to negative. Technical score fell to 1.0 from 2.5 out of 3.0. Short term momentum indicators are trending down.
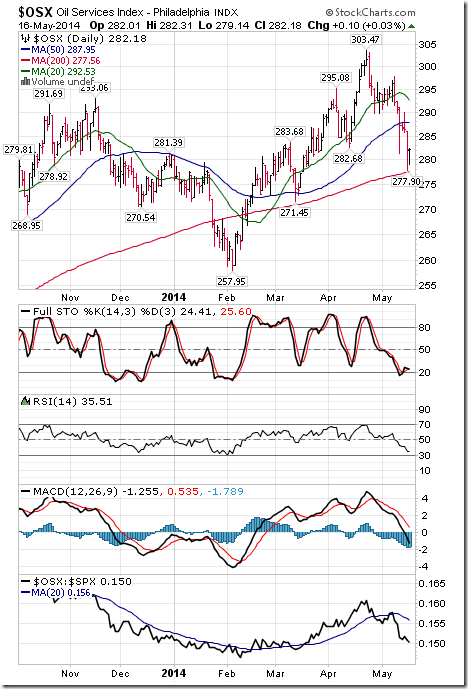
The Philadelphia Oil Services Index fell 8.48 points (3.91%) last week. Intermediate trend changed from up to down on a move below 289.82. The Index remains below its 20 day moving average. Strength relative to the S&P 500 Index remains negative. Technical score fell to 0.0 from 1.0 out of 3.0. Short term momentum indicators are trending down, but are oversold.
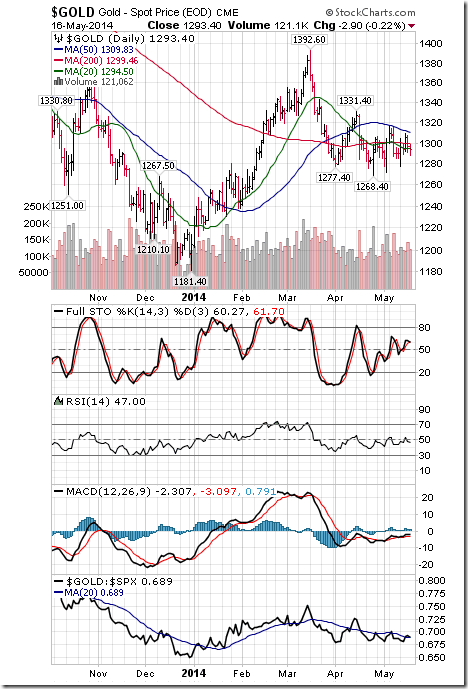
Gold added $4.00 per ounce (0.31%) last week. Intermediate trend remains down. Gold remains below its 20 day moving average. Strength relative to the S&P 500 Index remains neutral. Technical score remains at 0.5 out of 3.0. Short term momentum indicators mixed.
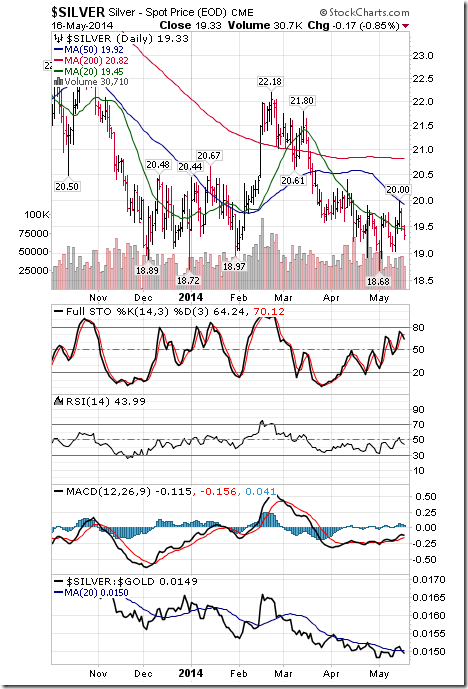
Silver added $0.16 (0.83%) last week. Intermediate trend remains down. Silver remains below its 20 day moving average. Strength relative to the S&P 500 Index and Gold improved to neutral from negative. Technical score improved to 0.5 from 0.0 out of 3.0
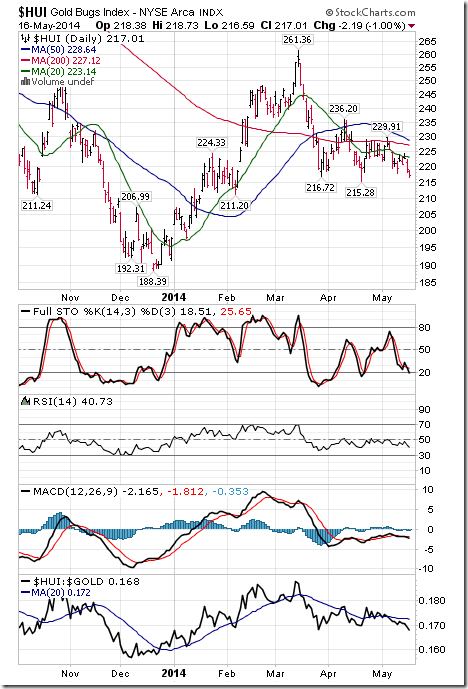
The Amex Gold Bug Index fell 2.45 points (1.12%) last week. Intermediate trend remains down. The Index remains below its 20 day moving average. Strength relative to the S&P 500 and Gold remains negative. Technical score remains at 0.0 out of 3.0. Short term momentum indicators are trending down.
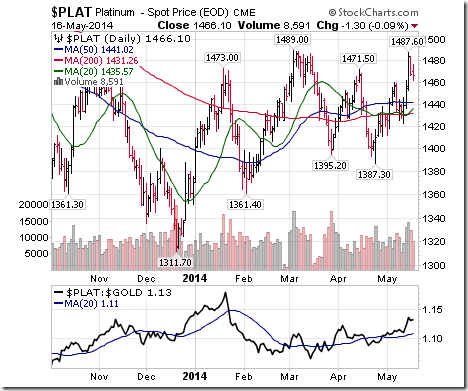
Platinum gained $33.70 (2.35%) last week. Intermediate trend changed from down to neutral following a move above $1,471.50. Platinum remains above its 20 day moving average. Strength relative to the S&P 500 and Gold changed from neutral to positive. Technical score: 2.5
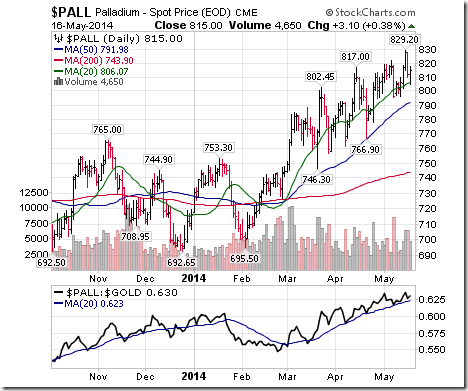
Palladium gained $13.50 per ounce (1.68%) last week. Trend remains up. Palladium remains above its 20 day average. Strength relative to S&P and Gold changed from neutral to positive.
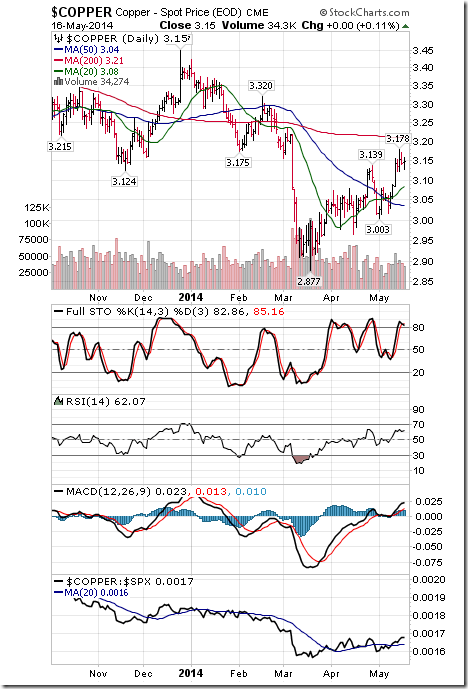
Copper added $0.06 per lb. (1.94%) last week. Intermediate uptrend was confirmed on a move above $1.319. Copper remains above its 20 day moving average. Strength relative to the S&P 500 Index changed from neutral to positive. Technical score improved to 3.0 from 2.5 out of 3.0. Short term momentum indicators are trending up, but are overbought.
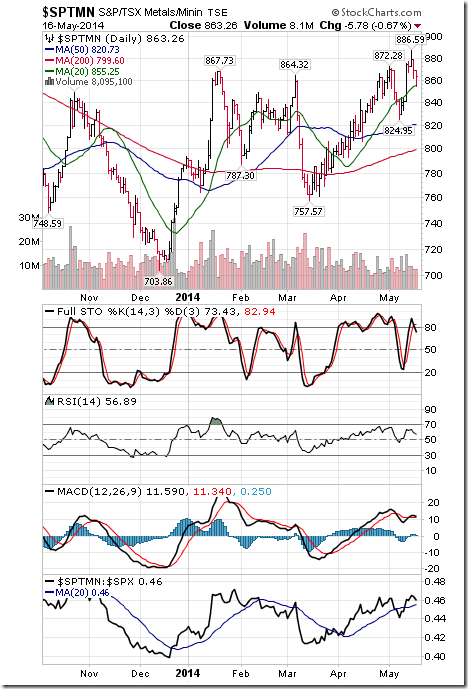
TSX Metals and Mining Index added 22.08 points (2.62%) last week. Intermediate trend remains up. The Index moved back above its 20 day moving average. Strength relative to the S&P 500 Index changed back from negative to positive. Technical score improved to 3.0 from 1.0 out of 3.0. Short term momentum indicators are mixed.
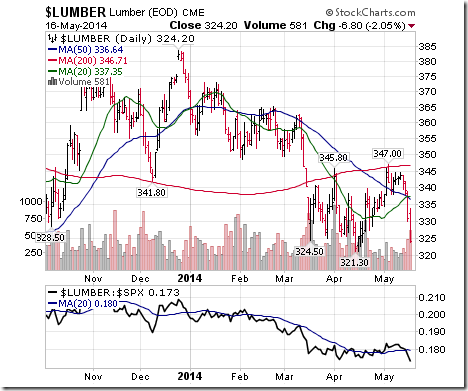
Lumber fell $18.80 (5.48%) last week. Trend remains neutral. Lumber fell below its 20 day moving average. Strength relative to the S&P 500 Index changed from positive to negative.
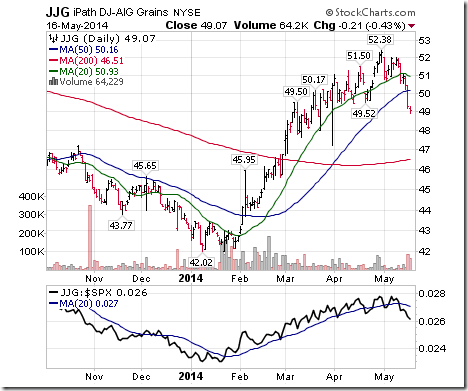
The grain ETN fell $2.45 (4.76%) last week. Intermediate trend remains up. Units fell below their 20 day moving average. Strength relative to the S&P 500 Index changed from neutral to negative. Technical score fell to 1.0 from 2.5 out of 3.0.
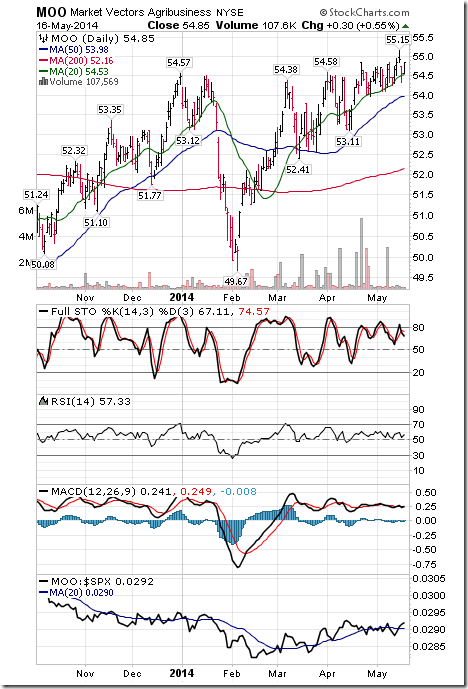
The Agriculture ETF added $0.53(0.98%) last week. Intermediate trend remains up. Units remain above its 20 day moving average. Strength relative to the S&P 500 Index changed from neutral to positive. Technical score improved to 3.0 from 2.5 out of 3.0. Short term momentum indicators are mixed.
Interest Rates
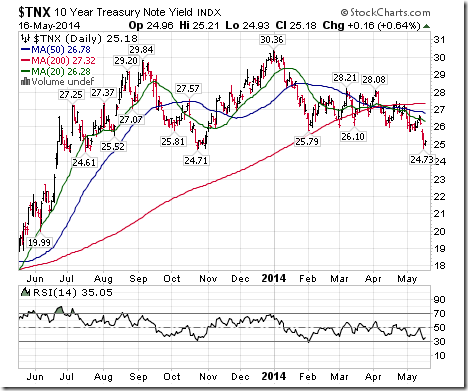
The yield on 10 year Treasuries dropped 10.5 basis points (4.00%) last week. Intermediate trend remains down. Yield remains below its 20 day moving average. Short term momentum indicators are trending down, but are oversold.
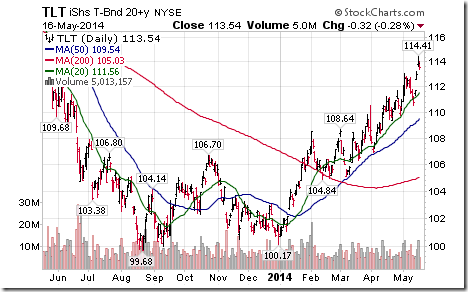
Conversely, price of the long term Treasury ETF gained $2.30 (2.07%) last week. Intermediate trend remains up. Units remain above their 20 day moving average.
Other Issues
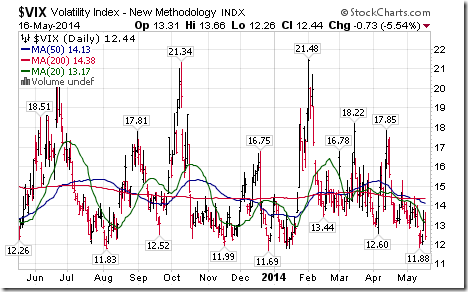
The Volatility Index fell 0.48 (3.72%) last week. Once again, the Index is testing long term support just below 12%.
Earnings focus this week is on Canadian banks
Short and intermediate technical indicators for most equity markets and sectors are overbought and trending down.
Economic news this week is quiet
Volume on Canadian and U.S. equity markets is expected to be lower than average due to holidays.
International focus remains on Ukraine.
The Memorial Day holiday trade begins this week. This year, the holiday is on May 26th. The Memorial Day holiday trade begins two trading days before the holiday and extends into the first five trading day in June.
North American equity markets historically move into a corrective phase between the end of April and the beginning of October during mid-term U.S. Presidential election cycle years.
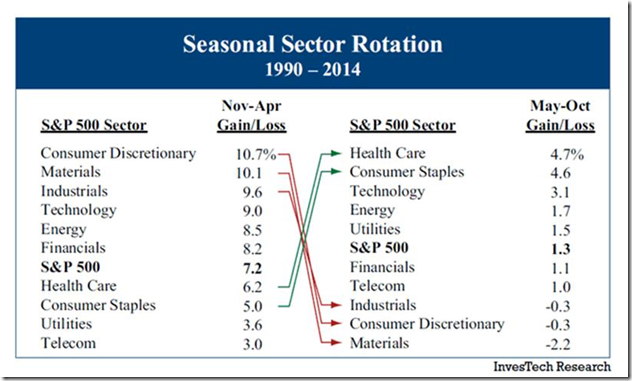
‘Tis the season for rotation from economically sensitive sectors to defensive sectors! Following is a chart developed by InvesTech Research that explains:
The Bottom Line
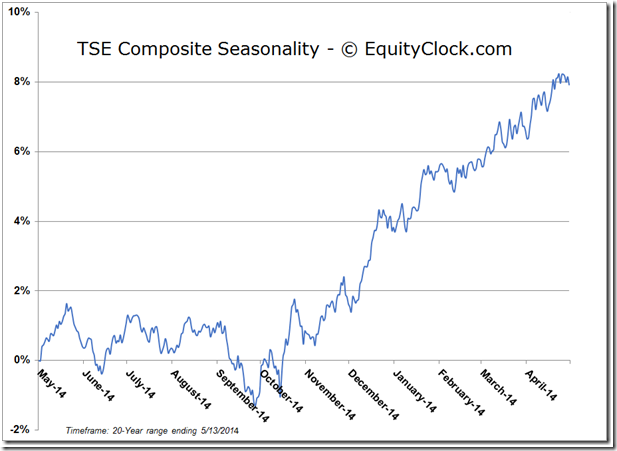
Equity markets around the world have ended their annual period of seasonal strength. Equity markets recently have entered into a period of higher than average volatility and lower returns from the first week in May to the last week in October. Strength if occurring is an opportunity to take profits, particularly in economic sensitive sectors.
Special Free Services available through www.equityclock.com
Equityclock.com is offering free access to a data base showing seasonal studies on individual stocks and sectors. The data base holds seasonality studies on over 1000 big and moderate cap securities and indices. To login, simply go to http://www.equityclock.com/charts/
Following is an example:
FP Trading Desk Headline
FP Trading Desk headline reads, “Bond yields point to weaker equity markets”. Following is a link:
http://business.financialpost.com/2014/05/16/bond-yields-point-to-weaker-equity-markets/
Disclaimer: Comments, charts and opinions offered in this report by www.timingthemarket.ca and www.equityclock.com are for information only. They should not be considered as advice to purchase or to sell mentioned securities. Data offered in this report is believed to be accurate, but is not guaranteed. Don and Jon Vialoux are Research Analysts with Horizons ETFs Management (Canada) Inc. All of the views expressed herein are the personal views of the authors and are not necessarily the views of Horizons ETFs Investment Management (Canada) Inc., although any of the recommendations found herein may be reflected in positions or transactions in the various client portfolios managed by Horizons ETFs Investment Management (Canada) Inc.
Twitter comments (Tweets) are not offered on individual equities held personally or in HAC.
Horizons Seasonal Rotation ETF HAC May 16th 2014
Copyright © Don Vialoux, Jon Vialoux, Brooke Thackray


