by Don Vialoux, Timing the Market
Interesting Charts
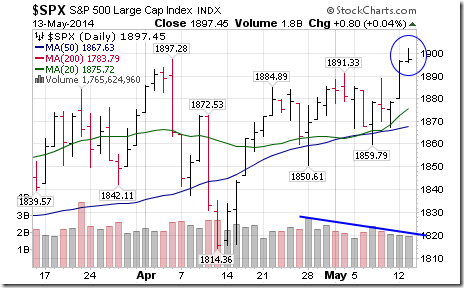
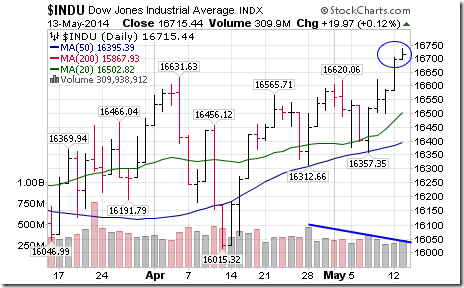
Failure to launch! The S&P 500 Index and the Dow Jones Industrial Average opened strongly yesterday into all-time highs, but bullish technical action following a breakout quickly dissipated. Traders responded to lower than expected April Retail Sales. This report was the first of a series of reports to be released this week that confirm or refute expectations for U.S. economic growth beyond the recovery following the weather-related slowdown in the first quarter. The April Retail Sales report tended to refute. Note the decline in volume, a technical sign showing lack of trader conviction following the breakouts.
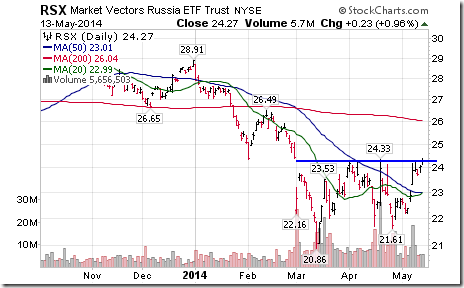
Strength in Russian equities and related ETFs imply a decline in political tension in Ukraine. RSX reached a ten week high yesterday.
Technical Action by Individual Equities Yesterday
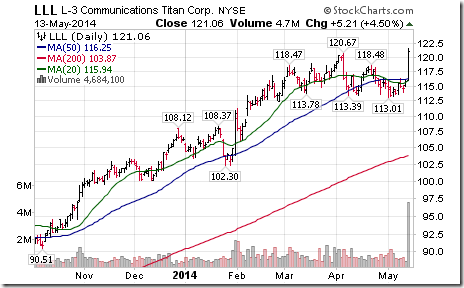
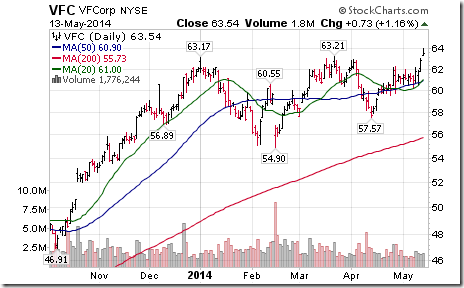
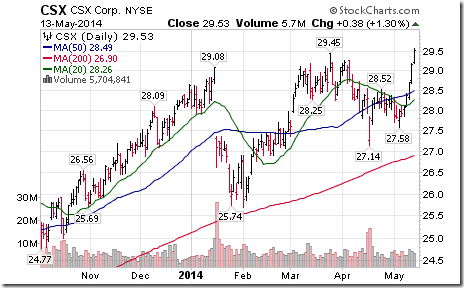
Technical action remained bullish. Sixteen S&P 500 stocks broke resistance and none broke support. Notable among stocks breaking resistance were L3 Communications, CSX and VF Corp. All broke to an all-time high.
Horizons Simulated Trading Competition Using ETFs
Horizons launches its simulated trading competition using ETFs on May 20th. Everyone is welcome. Cost to participants is zero. Should be fun! Cash prize is $13,000. Following is a link giving more details and a connection to register:
http://thebiggestwinner.stocktrak.com/home.aspx
FP Trading Desk Headlines
FP Trading Desk headline reads, “Valuing free cash flow in the gold mining space”. Following is a link:
http://business.financialpost.com/2014/05/13/valuing-free-cash-flow-in-the-gold-mining-space/
FP Trading Desk headline reads, “Market fears drive investor cash holdings to two year highs”. Following is a link:
Special Free Services available through www.equityclock.com
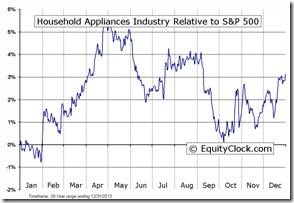
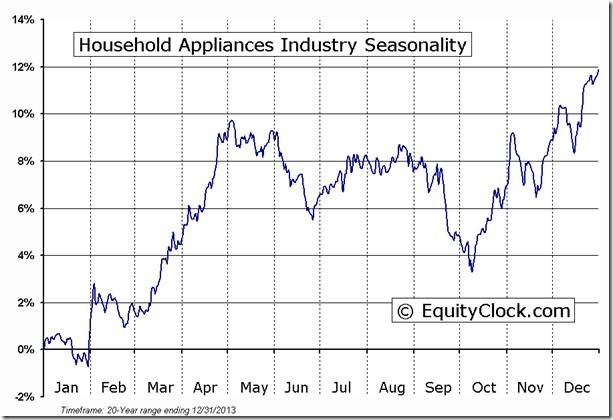
Equityclock.com is offering free access to a data base showing seasonal studies on individual stocks and sectors. The data base holds seasonality studies on over 1000 big and moderate cap securities and indices. To login, simply go to http://www.equityclock.com/charts/
Following is an example:
Household Appliances Industry Seasonal Chart
 |
Disclaimer: Comments, charts and opinions offered in this report by www.timingthemarket.ca and www.equityclock.com are for information only. They should not be considered as advice to purchase or to sell mentioned securities. Data offered in this report is believed to be accurate, but is not guaranteed. Don and Jon Vialoux are Research Analysts with Horizons ETFs Management (Canada) Inc. All of the views expressed herein are the personal views of the authors and are not necessarily the views of Horizons ETFs Investment Management (Canada) Inc., although any of the recommendations found herein may be reflected in positions or transactions in the various client portfolios managed by Horizons ETFs Investment Management (Canada) Inc.
Twitter comments (Tweets) are not offered on individual equities held personally or in HAC.
Horizons Seasonal Rotation ETF HAC May 13th 2014
Copyright © Don Vialoux, Jon Vialoux, Brooke Thackray


![clip_image002[5] clip_image002[5]](https://advisoranalyst.com/wp-content/uploads/2019/08/02b2adb9fb59a8bcee5852f330b59c68.png)


