by Don Vialoux, Timing the Market
Economic News This Week
April Retail Sales to be released at 8:30 AM EDT on Tuesday are expected to increase 0.3% versus a gain of 1.2% in March. Excluding auto sales, Sales are expected to increase 0.6% versus a gain of 0.7% in March.
April Producer Prices to be released at 8:30 AM EDT on Wednesday are expected to increase 0.2% versus a gain of 0.5% in March. Excluding food and energy PPI is expected to increase 0.2% versus a gain of 0.6% in March.
Federal Reserve Chairman Janet Yellen is expected to speak in Washington at 7:00 PM EDT on Thursday
April Consumer Prices to be released at 8:30 AM EDT on Thursday are expected to increase 0.3% versus a gain of 0.2% in March. Excluding food and energy, CPI is expected to increase 0.2% versus a gain of 0.2% in March.
Weekly Initial Jobless Claims to be released at 8:30 AM EDT on Thursday are expected to increase to 325,000 from 319,000 last week.
May Empire State Manufacturing Index to be released at 8:30 AM EDT on Thursday is expected to improve to 4.8 from 1.3 in April.
Canada’s Existing April Home Sales to be released at 9:00 AM EDT on Thursday are expected to increase 2.0% versus a gain of 1.0% in March.
April Industrial Production to be released at 9:15 AM EDT on Thursday is expected to increase 0.1% versus a gain of 0.7% in March. April Capacity Utilization is expected to remain unchanged from March at 79.2%.
May Philadelphia Fed Manufacturing Index to be released at 10:00 AM EDT on Thursday is expected to fall to 9.1 from 16.6 in April
April Housing Starts to be released at 10:00 AM EDT on Friday are expected to increase to 975,000 from 946,000 in March.
May Michigan Sentiment Index to be released at 9:55 AM EDT on Friday is expected to increase to 84.5 from 84.1 in April.
Earnings News
Monday: Pengrowth Energy
Tuesday: First Majestic Silver, Manitoba Telecom
Wednesday: Cisco, Macy’s, Power Financial
Thursday: CAE, JC Penney
Friday: Onex
Equity Trends
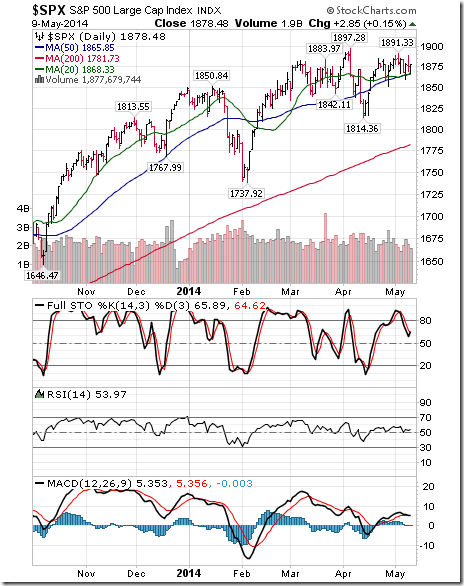
The S&P 500 Index slipped 2.66 points (0.14%) last week. Intermediate trend remains neutral. The Index continues to bounce from near its 20 day moving average. Short term momentum indicators have rolled over from overbought levels and are trending down.
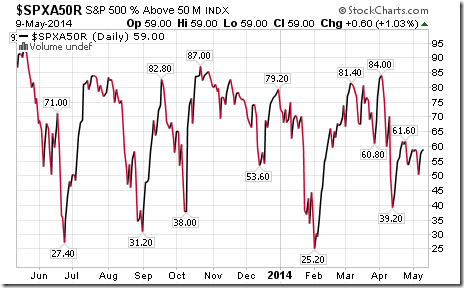
Percent of S&P 500 stocks trading above their 50 day moving average was unchanged last week at 59.00%. Percent remains intermediate overbought.
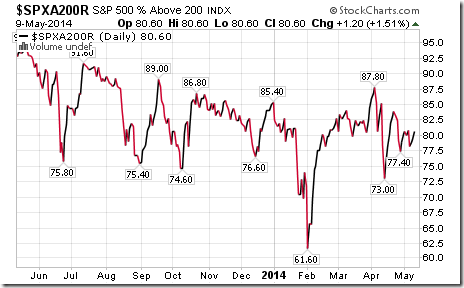
Percent of S&P 500 stocks trading above their 200 day moving average increased last week to 80.60% from 80.00%. Percent remains intermediate overbought.
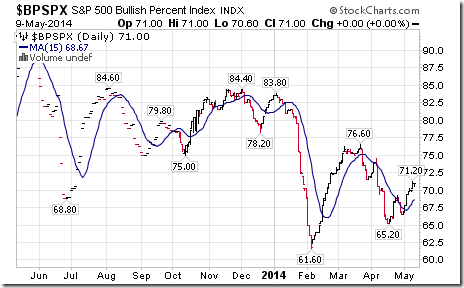
Bullish Percent Index for S&P 500 stocks increased last week to 71.00% and remains above its 15 day moving average. The Index remains intermediate overbought.
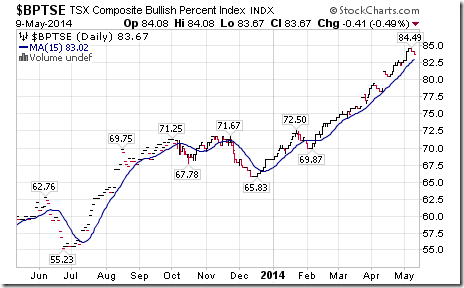
Bullish Percent Index for TSX stocks slipped last week to 83.67% from 84.08% but remained above its 15 day moving average. The Index remains intermediate overbought.
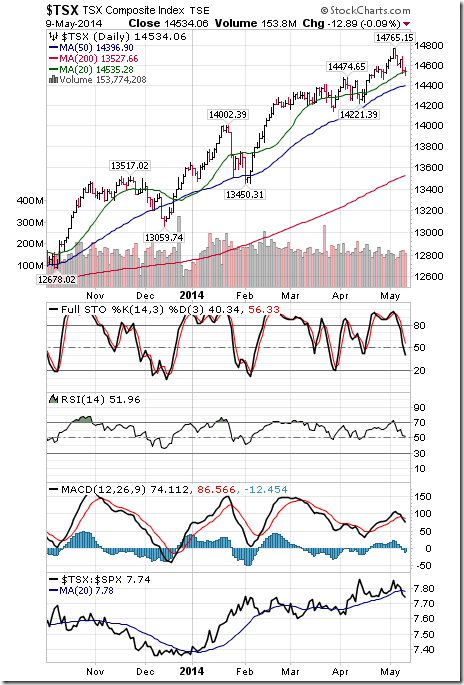
The TSX Composite Index fell 231.09 points (1.53%) last week. Intermediate trend remains up (Score: 1.0). The Index fell below its 20 day moving average on Friday (Score: 0.0). Strength relative to the S&P 500 Index changed from positive to negative (Score: 0.0). Technical score fell to 1.0 from 3.0 out of 3.0. Short term momentum indicators are trending down.
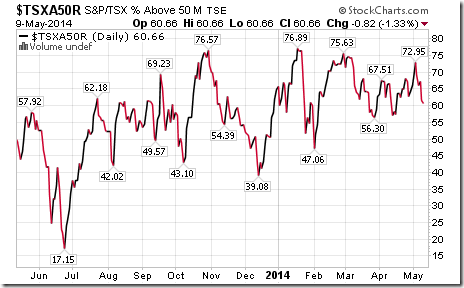
Percent of TSX stocks trading above their 50 day moving average fell last week to 60.66% from 72.95%. Percent remains intermediate overbought. Historically, a move below 70% has signalled the start of an intermediate downtrend in the Index.
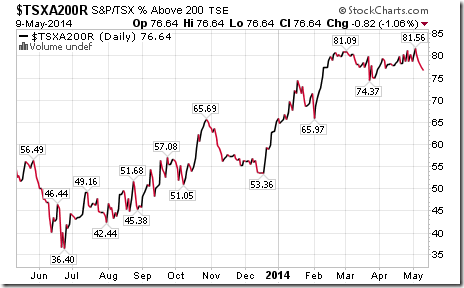
Percent of TSX stocks trading above their 200 day moving average fell last week to 76.64% from 81.56%. Percent remains intermediate overbought and showing early signs of trending down.
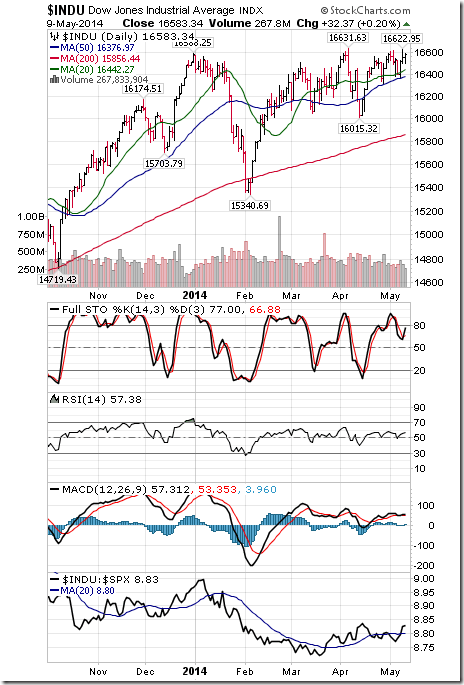
The Dow Jones Industrial Average gained 70.43 points (0.43%) last week. Intermediate trend remains neutral. The Average remains above its 20, 50 and 200 day moving averages. Strength relative to the S&P 500 Index changed from negative to neutral. Short term momentum indicators are overbought.
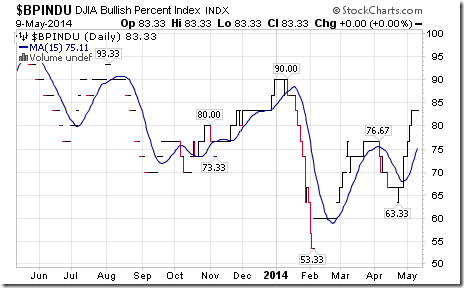
Bullish Percent Index for Dow Jones Industrial Average stocks increased last week to 83.33% and remained above its 15 day moving average. The Index remains intermediate overbought.
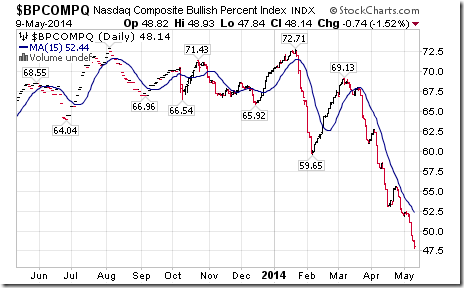
Bullish Percent Index for NASDAQ Composite stocks fell last week to 48.14% from 52.33% and remained below its 15 day moving average. The Index continues to trend down.
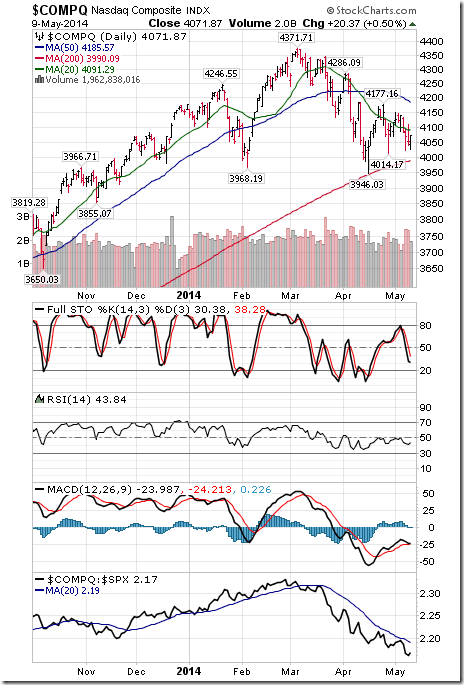
The NASDAQ Composite Index fell 52.03 points (1.26%) last week. Intermediate trend remains down. The Index fell below its 20 day moving average. Strength relative to the S&P 500 Index remains negative. Technical score remains at 0.0 out of 3.0. Short term momentum indicators are trending down.
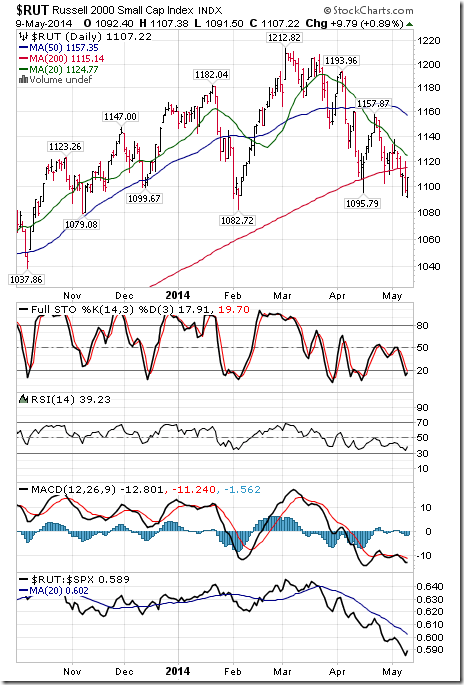
The Russell 2000 Index dropped 21.58 points (1.91%) last week. Intermediate trend remains down. The Index remains below its 20 day moving average. Strength relative to the S&P 500 Index remains negative. Technical score remains at 0.0 out of 3.0. Short term momentum indicators are trending down and oversold.
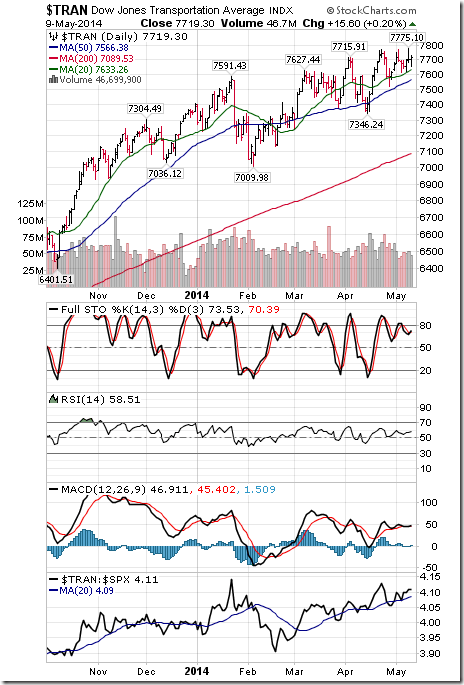
The Dow Jones Transportation Average added 20.46 points (0.26%) last week. Intermediate trend remains up. The Average remains above its 20 day moving average. Strength relative to the S&P500 Index remains positive. Technical score remains at 3.0 out of 3.0. Short term momentum indicators are trending up, but are overbought.
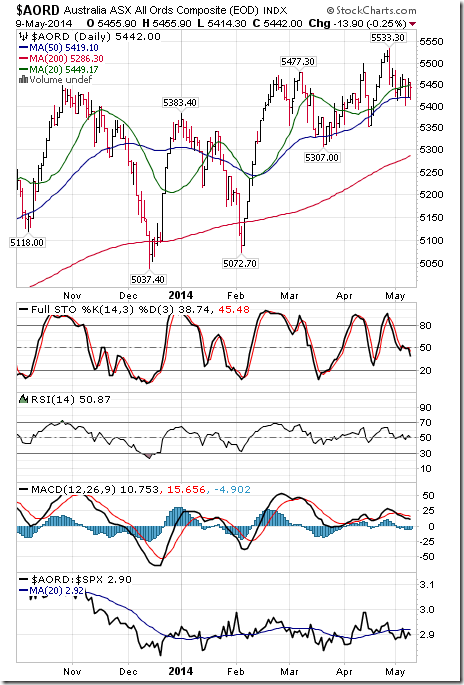
The Australia All Ordinaries Composite Index added 3.20 points (0.06%) last week. Intermediate trend remains up. The Index remains below its 20 day moving average. Strength relative to the S&P 500 Index remains negative. Technical score remains at 1.0 out of 3.0. Short term momentum indicators are trending down.
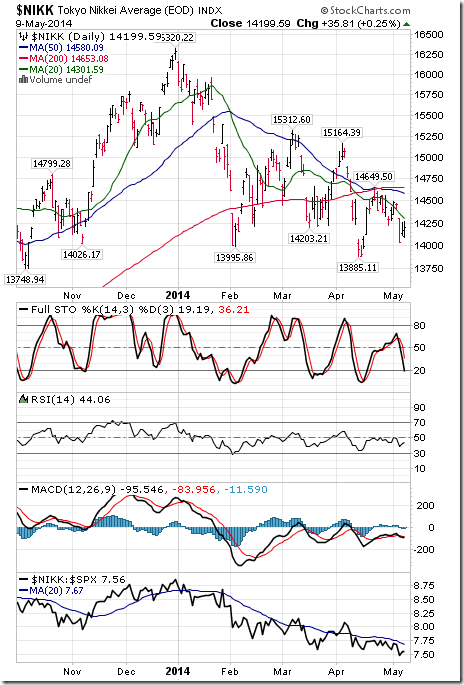
The Nikkei Average dropped 257.92 points (1.78%) last week. Intermediate trend remains down. The Average fell below its 20 day moving average. Strength relative to the S&P 500 Index remains negative. Technical score fell to 0.0 from 1.0 out of 3.0. Short term momentum indicators are trending down and are oversold.
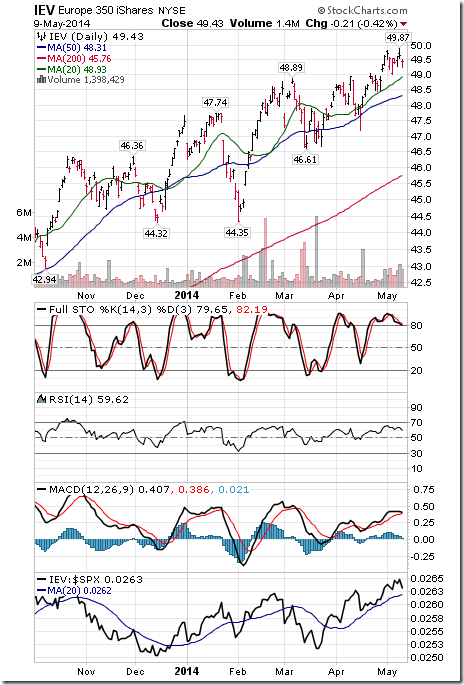
iShares Europe 350 units slipped $0.11 (0.22%) last week. Intermediate trend remains up. Units remain above their 20 day moving average. Strength relative to the S&P 500 Index remains positive. Technical score remains at 3.0 out of 3.0. Short term momentum indicators are rolling over from overbought levels.
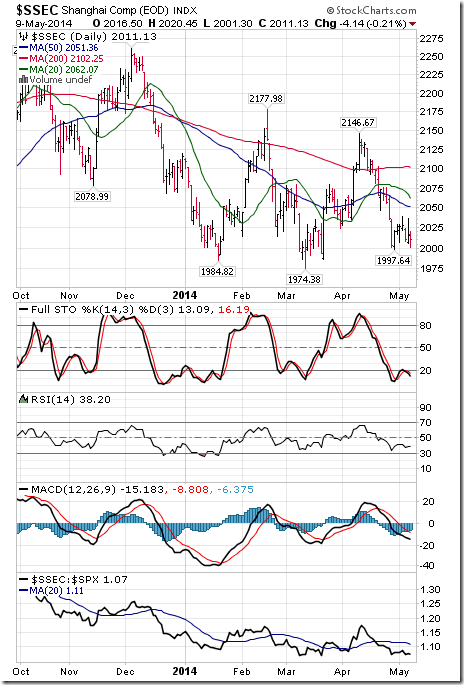
The Shanghai Composite Index dropped 15.63 points (0.75%) last week. Intermediate trend remains neutral. The Index remains below its 20 day moving average. Strength relative to the S&P 500 Index remains negative. Technical score remains at 0.5 out of 3.0. Short term momentum indicators are trending down, but are oversold.
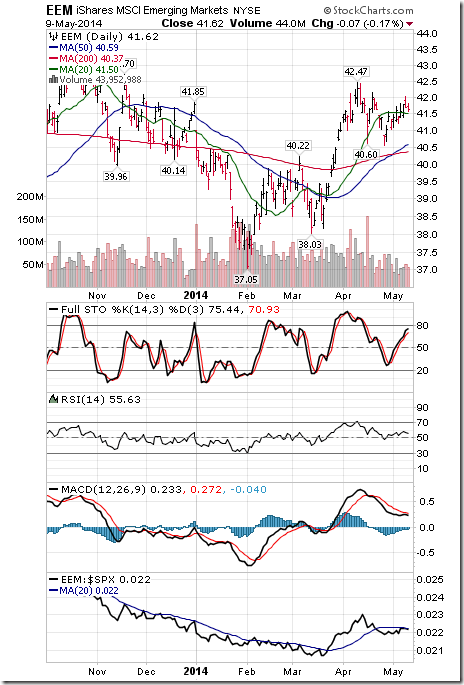
iShares Emerging Markets added $0.01 (0.20%) last week. Intermediate trend remains up. Units remain above their 20 day moving average. Strength relative to the S&P 500 Index changed from negative to neutral. Technical score improved to 2.5 from 2.0 out of 3.0. Short term momentum indicators are mixed.
Currencies
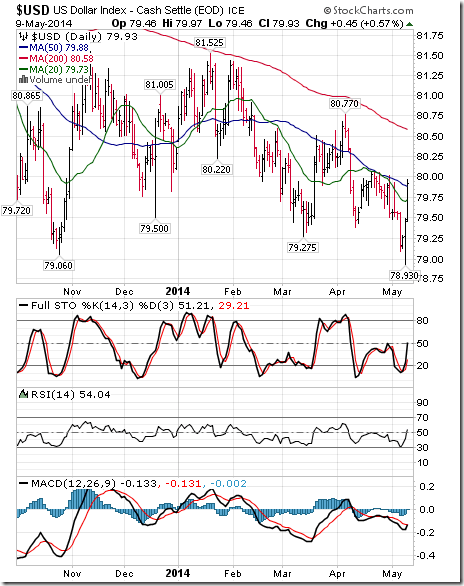
The U.S. Dollar Index added 0.37 (0.47%) last week. Intermediate trend changed from neutral to negative on a move below 79.275. The Index moved above its 20 day moving average. Short term momentum indicators are trending up.
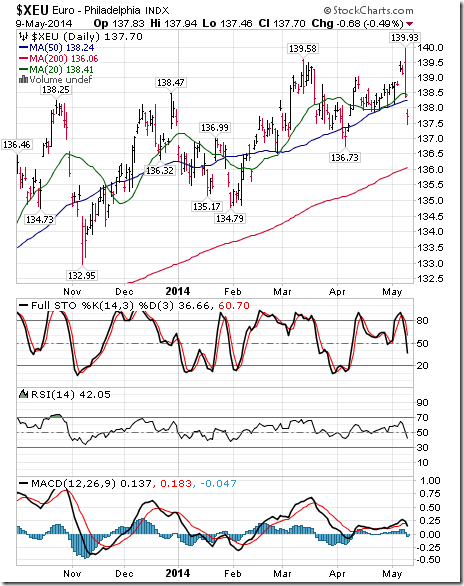
The Euro fell 1.01 (0.73%) last week. Intermediate trend remains up. The Euro fell below its 20 and 50 day moving averages. Short term momentum indicators are trending down.
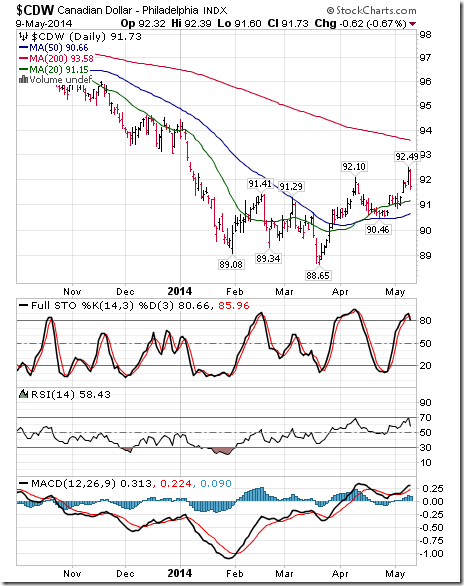
The Canadian Dollar gained 0.68 (0.75%) last week. Intermediate trend changed to up from neutral on a move above 92.10. The Dollar remains above its 20 day moving average. Short term momentum indicators are trending up, but are overbought.
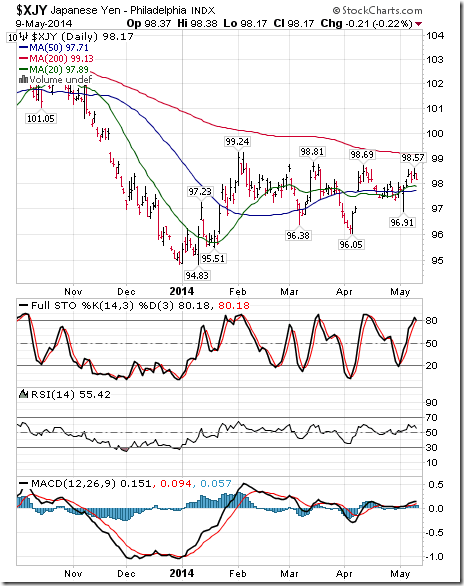
The Japanese Yen added 0.36 (0.37%) last week. Intermediate trend remains down. The Yen remains above its 20 day moving average. Short term momentum indicators are trending up.
Commodities
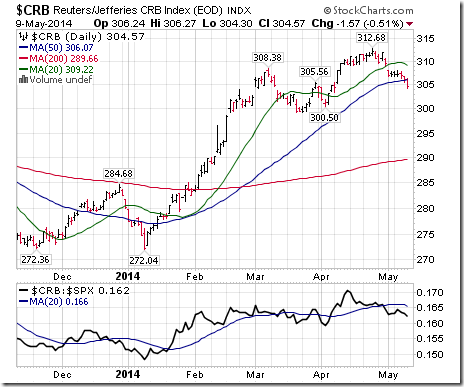
The CRB Index fell 2.57 points (0.84%) last week. Intermediate trend remains up. The Index remains below its 20 day moving average. Strength relative to the S&P 500 Index remains negative. Technical score remains at 1.0 out of 3.0.
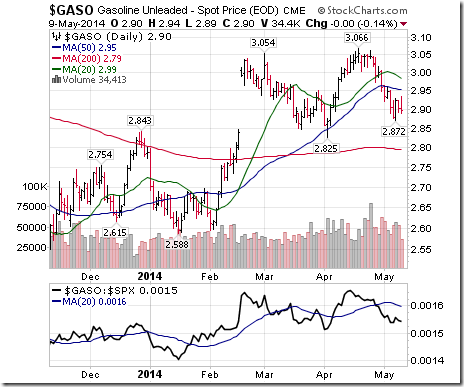
Gasoline fell $0.04 per gallon (1.36%) last week. Intermediate trend remains up. Gasoline remains below its 20 day moving average. Strength relative to the S&P 500 Index remains negative. Technical score remains at 1.0 out of 3.0.
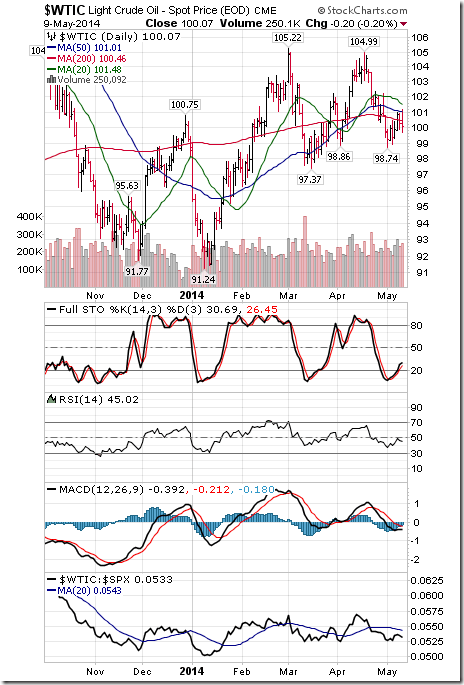
Crude Oil added $0.31 per barrel (0.31%) last week. Intermediate trend remains neutral. Crude remains below its 20 day moving average. Strength relative to the S&P 500 Index remains negative. Technical score remains at 0.5 out of 3.0.
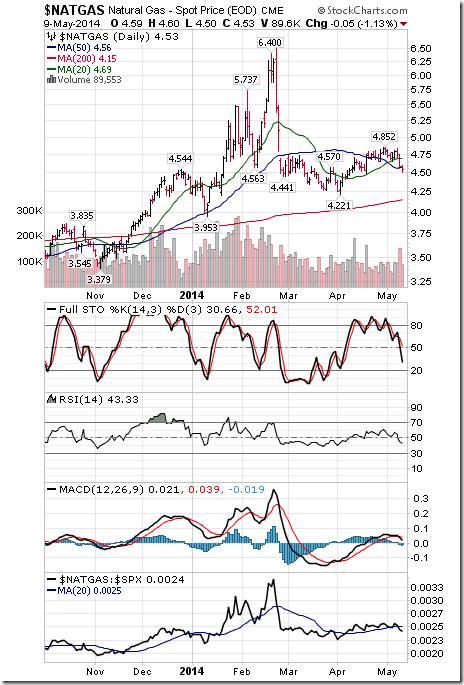
Natural Gas fell $0.14 per MBtu (3.00%) last week. Intermediate trend remains neutral. Gas fell below its 20 day moving average. Strength relative to the S&P 500 Index remains neutral. Technical score fell to 1.0 from 2.0 out of 3.0. Short term momentum indicators are trending down.
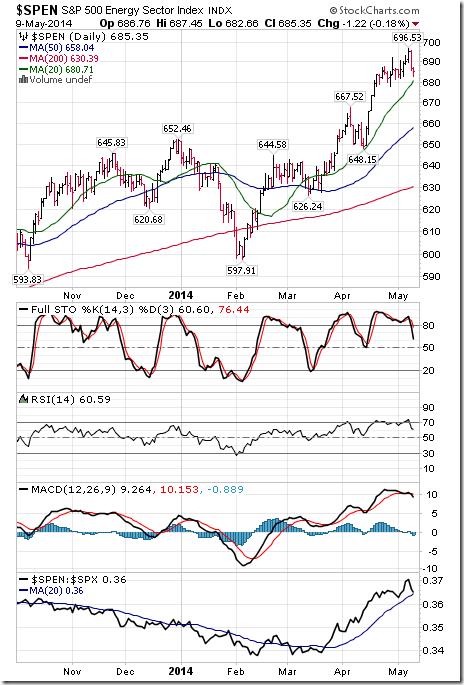
The S&P Energy Index slipped 0.68 (0.10%) last week. Intermediate trend remains up. The Index remains above its 20 day moving average. Strength relative to the S&P 500 Index changed from positive to neutral. Technical score slipped to 2.5 from 3.0 out of 3.0. Short term momentum indicators are trending down.
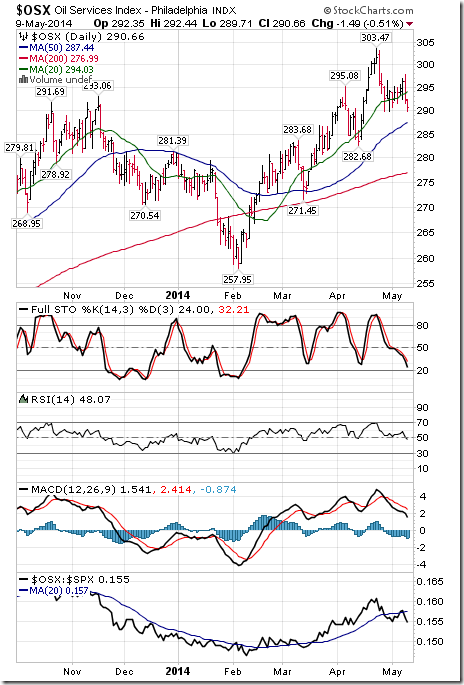
The Philadelphia Oil Services Index fell 3.30 points (1.12%) last week. Intermediate trend remains up. The Index fell below its 20 day moving average. Strength relative to the S&P 500 changed from neutral to negative. Technical score fell to 1.0 from 2.5 out of 3.0. Short term momentum indicators are trending down.
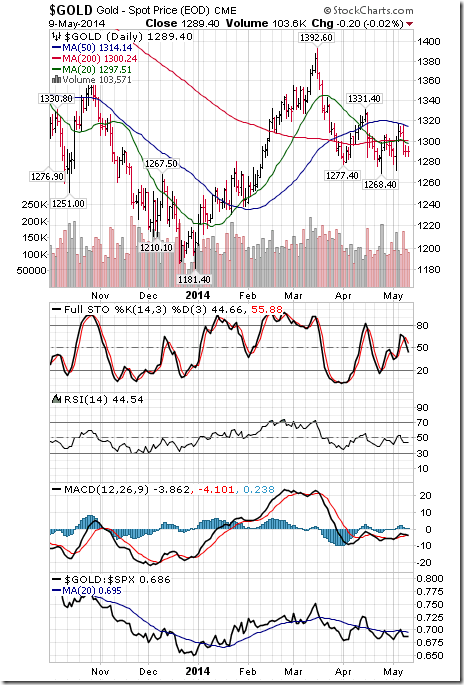
Gold fell $13.50 per ounce (1.04%) last week. Intermediate trend remains down. Gold fell below its 20 day moving average. Strength relative to the S&P 500 Index remains neutral. Technical score fell to 0.5 from 1.5 out of 3.0. Short term momentum indicators are mixed.
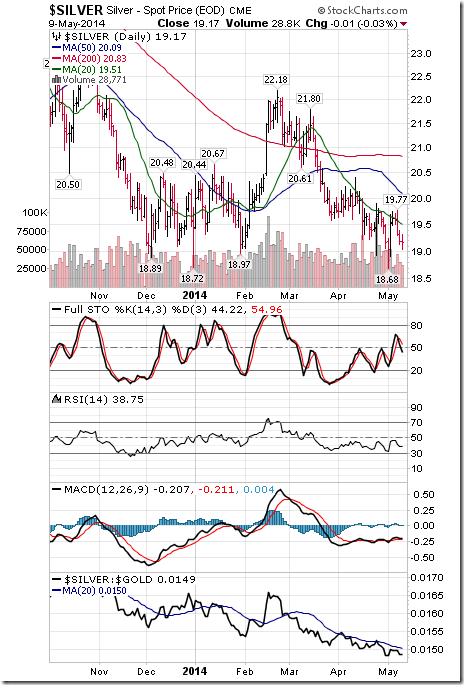
Silver fell $0.38 per ounce (1.94%) last week. Intermediate trend remains down. Silver remains below its 20 day moving average. Strength relative to the S&P 500 Index and Gold remains negative. Technical score remains at 0.0 out of 3.0. Short term momentum indicators are mixed.
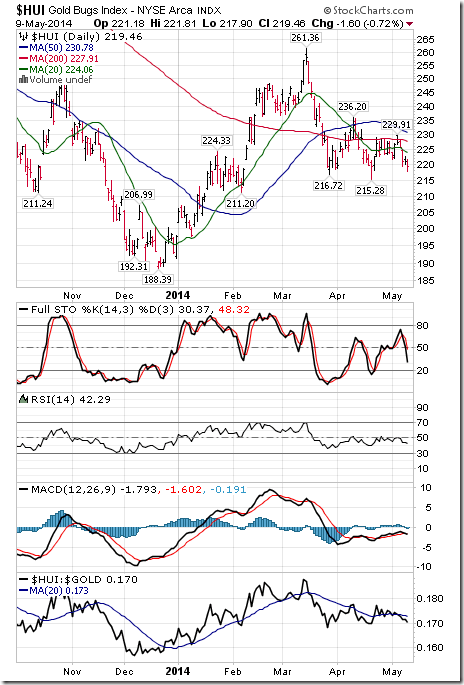
The AMEX Gold Bug Index fell 7.12 points (3.14%) last week. Intermediate trend remains down. The Index fell below its 20 day moving average. Strength relative to the S&P 500 Index and Gold changed from neutral to negative. Technical score fell to 0.0 from 1.5 out of 3.0. Short term momentum indicators are mixed.
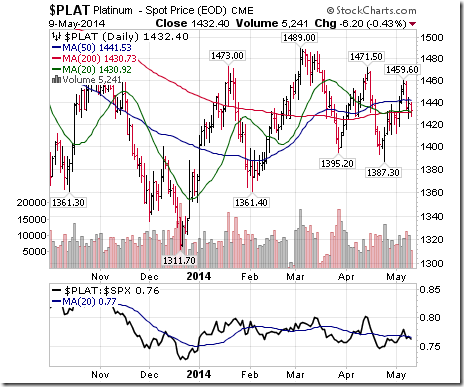
Platinum slipped $8.30 (0.57%) last week. Intermediate trend remains down. Platinum remains above its 20 day moving average. Strength relative to the S&P 500 Index and Gold remains neutral. Technical score remains at 1.5 out of 3.0.
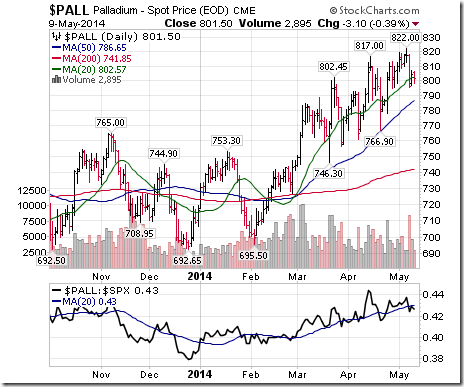
Palladium dropped $10.90 per ounce (1.34%) last week. Trend remains up. Palladium fell below its 20 day moving average. Strength relative to S&P 500 and Gold changed from Neutral.
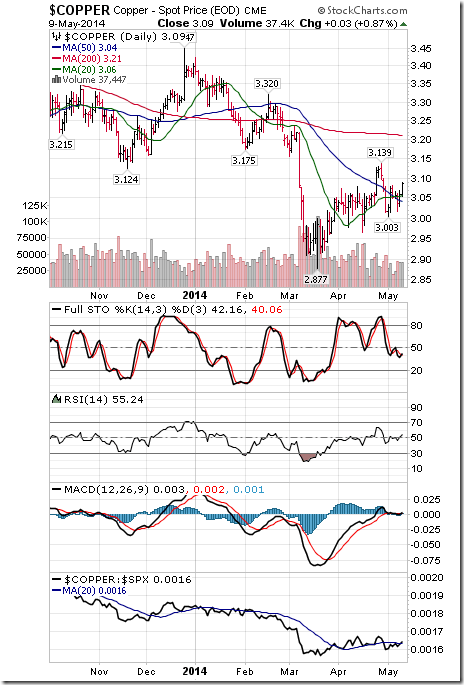
Copper added $0.02 per lb. (0.65%) last week. Intermediate trend remains up. Copper remains above its 20 day moving average. Strength relative to the S&P 500 Index remains neutral. Technical score remains at 2.5 out of 3.0. Short term momentum indicators are mixed.
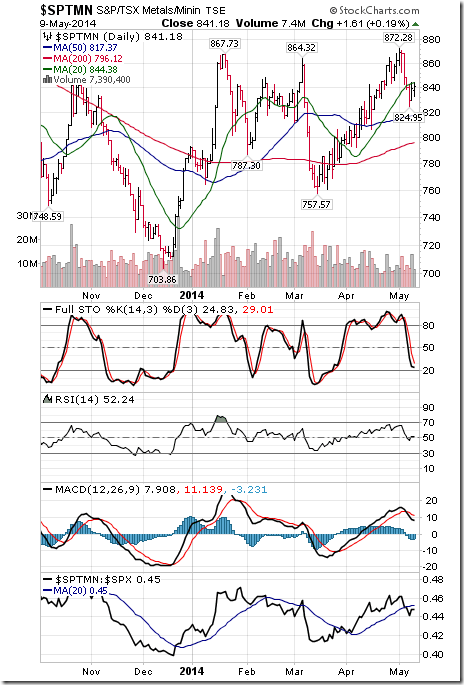
TSX Metals & Mining Index plunged 27.48 points (3.16%) last week. Intermediate trend remains up. The Index fell below its 20 day moving average. Strength relative to the S&P 500 Index changed from positive to negative. Technical score fell to 1.0 from 3.0 out of 3.0. Short term momentum indicators are trending down.
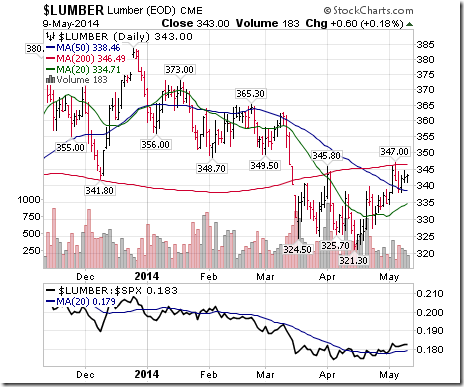
Lumber slipped $1.50 (0.44%) last week. Trend changed from down to neutral on a move above $345.80. Lumber remains above its 20 day MA. Strength relative to S&P remains positive.
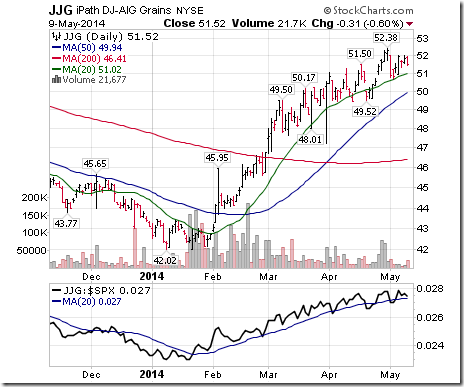
The grain ETN added $0.70 (1.38%) last week. Intermediate trend remains up. Units remain above their 20 day moving average. Strength relative to the S&P 500 improved to positive from neutral. Technical score improved to3.0 from 2.5 out of 3.0.
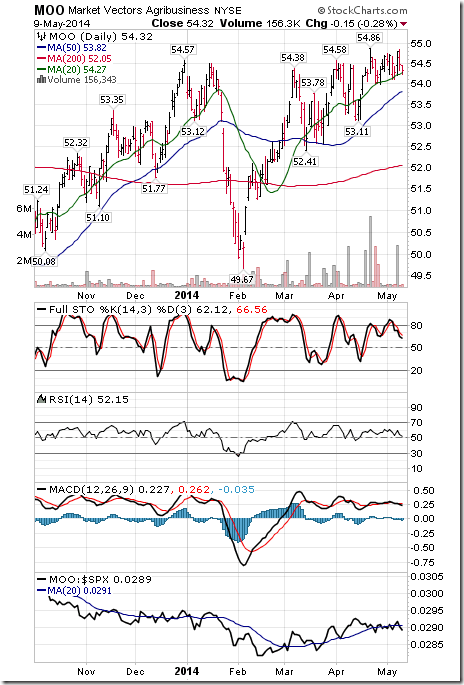
The Agriculture ETF slipped $0.39 (0.71%) last week. Intermediate trend remains up. Units remain above their 20 day moving average. Strength relative to the S&P 500 Index remains neutral. Technical score remains at 2.5 out of 3.0 Short term momentum indicators are mixed.
Interest Rates
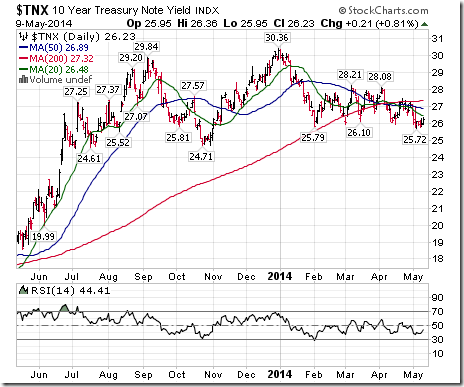
The yield on 10 year Treasuries added 3.2 basis points (1.24%) last week. Intermediate trend remains down. Yield remains below its 20 day moving average. Short term momentum indicators are neutral.
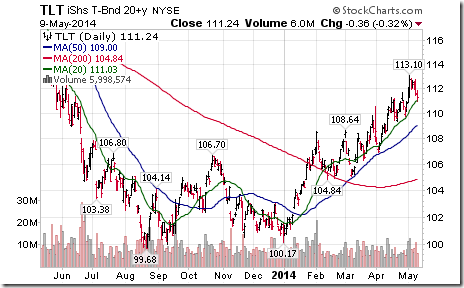
Conversely, price of the long term Treasury ETF fell $1.47 (1.39%) last week. Intermediate trend remains up. Units remain above their 20 day moving average.
Other Issues
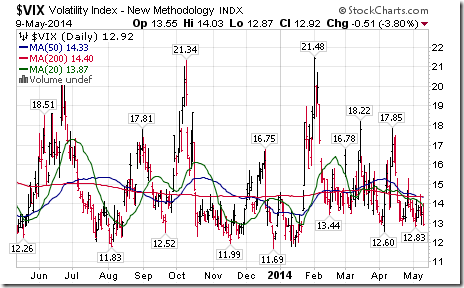
The Volatility Index added 0.01 (0.08%) last week.
Quarterly earnings reports no longer are a significant influence on equity markets.
Short and intermediate term technical indicators are overbought and rolling over for a wide variety of equity markets and sectors.
Economic news is a focus this week. April reports will continue to point to a recovery from weak weather-driven data during the December-March period. However, reports for May will appear for the first time (Philadelphia Fed, Empire Manufacturing, Michigan Sentiment). These reports will answer the question, “Was the economic recovery due to weather only or was it part of a continuing recovery”? The former scenario implies continuation of a trendless market in the U.S. that started at the end of December. The latter scenario implies significant downside risk into this summer.
U.S. equity markets have a history of peaking near the end of April during colder than average years followed by a shallow correction until October.
International focus remains on Ukraine.
Today is the day after Mother’s Day. According to EquityClock, the trading day after Mother’s Day has been one of the strongest days of the year for the S&P 500. On average since 1990, the Index has increased 70% for an average gain per period of 0.47%.
On average, optimal day for the end of the period of seasonal strength for most equity markets around the world is May 5th. Technical action in a wide variety of indices and economically sensitive sectors (including the TSX Composite, TSX Metals & Mining and TSX Energy) that recorded short term sell signals last week suggests that history is repeating.
On average North American equity markets have a history of moving lower from late April to early October during U.S. mid-term election years.
The Bottom Line
The S&P 500 Index, Dow Jones Industrial Average and economic sensitive sectors (Technology, Industrials, Materials) reached an intermediate peak on April 4th and have struggled since then with increasing volatility. In addition, their period of seasonal strength is at or near the end. Strength is an opportunity to take profits. Reductions to market and economic sensitive sectors are prudent at current prices.
Special Free Services available through www.equityclock.com
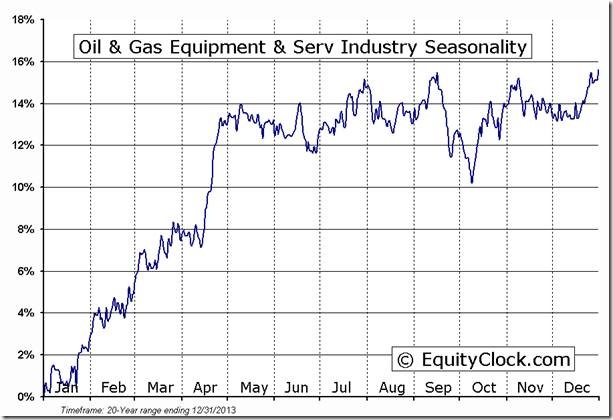
Equityclock.com is offering free access to a data base showing seasonal studies on individual stocks and sectors. The data base holds seasonality studies on over 1000 big and moderate cap securities and indices. To login, simply go to http://www.equityclock.com/charts/
Following is an example:
Oil & Gas Equipment Industry Seasonal Chart
S5OILE Index Relative to the S&P 500 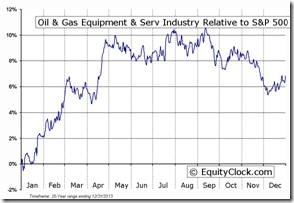 |
S5OILE Index Relative to the Sector 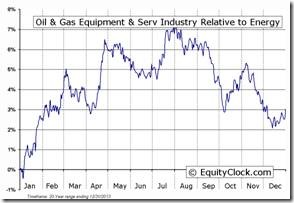 |
Tech Talk’s Report at Globeinvestors.com
Headline reads, “It’s time to take profits in the Canadian Equity Market”. Following is a link:
Tech Talk on BNN’s Market Call Tonight taped on Friday
Following are links:
http://www.bnn.ca/Video/player.aspx?vid=356482
http://www.bnn.ca/Video/player.aspx?vid=361152
Disclaimer: Comments, charts and opinions offered in this report by www.timingthemarket.ca and www.equityclock.com are for information only. They should not be considered as advice to purchase or to sell mentioned securities. Data offered in this report is believed to be accurate, but is not guaranteed. Don and Jon Vialoux are Research Analysts with Horizons ETFs Management (Canada) Inc. All of the views expressed herein are the personal views of the authors and are not necessarily the views of Horizons ETFs Investment Management (Canada) Inc., although any of the recommendations found herein may be reflected in positions or transactions in the various client portfolios managed by Horizons ETFs Investment Management (Canada) Inc.
Twitter comments (Tweets) are not offered on individual equities held personally or in HAC.
Horizons Seasonal Rotation ETF HAC May 9th 2014
Copyright © Don Vialoux, Jon Vialoux, Brooke Thackray


