by Don Vialoux, Timing the Market
Editor’s Note: Mr. Vialoux is scheduled to appear on BNN Television this evening at 6:00 PM
Interesting Charts
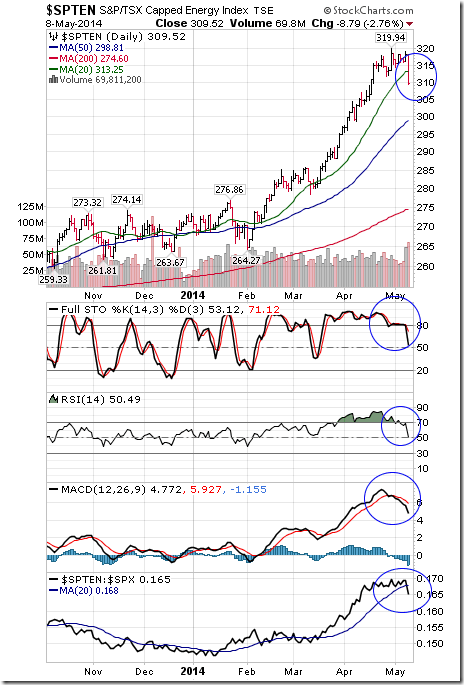
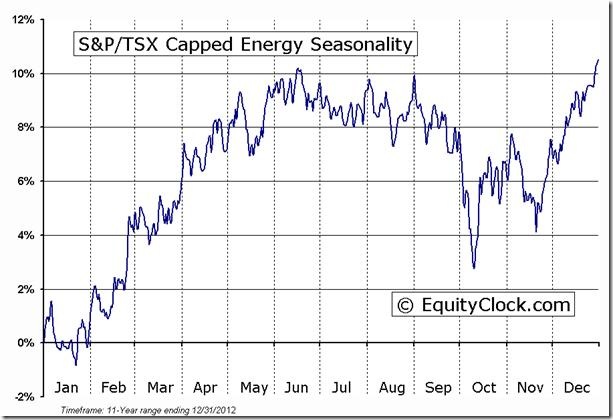
Technical signs of the end of the period of seasonal strength in the TSX Energy sector (i.e. first week in May) have appeared. The Index fell below its 20 day moving average, began to underperform the S&P 500 Index and recorded short term momentum sell signals.
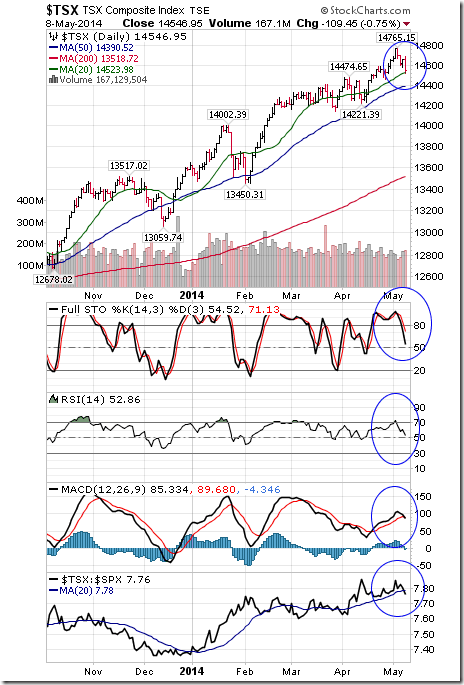
Technical signs of an end of the period of seasonal strength by the TSX Composite Index also have appeared. The Index likely will fall below its 20 day moving average this morning, has started to underperform the S&P 500 Index and recorded short term momentum sell signals.
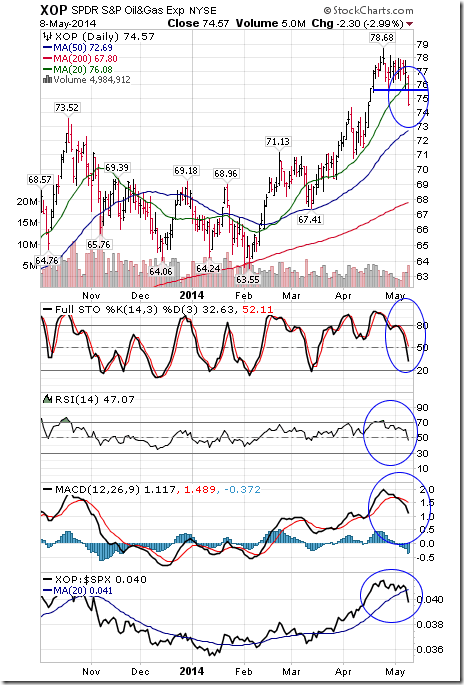
U.S. Oil and Gas Exploration equities and related ETFs also recorded deteriorating technicals
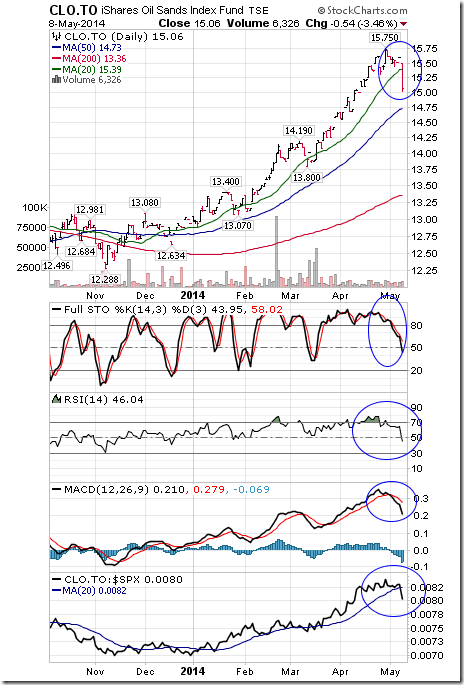
Ditto for Canada’s oil sands stocks and their related ETF!
Technical Action by Individual Equities Yesterday
Technical action by S&P 500 stocks was quietly bullish yesterday. Eight stocks broke resistance and two broke support.
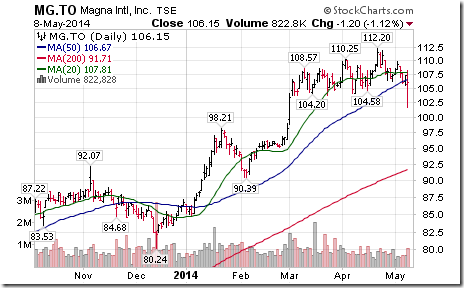
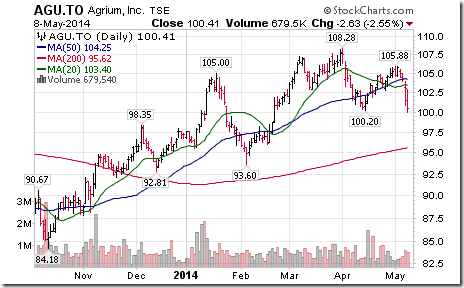
Two TSX 60 stocks broke support: Magna International and Agrium.
FP Trading Desk Headline
FP Trading Desk headline reads, “Agrium downgraded on weaker guidance and macro outlook”. Following is a link:
Adrienne Toghraie’s “Trader’s Coach” Column
|
Doing Whatever it Takes
By Adrienne Toghraie, Trader’s Success Coach
Sometimes the price to pay is too much to make a dream come true. In my own life, I have paid a huge price for my success, but it was worth it, and for the past 23 years, I have witnessed the sacrifices my clients have made in their lives as well to make their dreams come true. The fact is that for most people there is limited:
· Time in a day
· Energy
· Capital
· Support that others will give you
· Patience to reach your goal
The question you need to ask yourself for becoming a trader or becoming a more successful trader is:
Is it worth the price and sacrifices?
It is easy to say, “yes” to this question when you first start out with a passionate dream and have not experienced all of the hurdles.
Do you have what it takes to stay the coarse?
Most people do not and that is why most people fail. You only need to look back at your life to see if you have a better chance to succeed. When you have taken on challenges in your life did you:
· Make a plan and stick to that plan
· Get cooperation and enthusiasm from others to support you in reaching your goals
· Push through the fact that it took a great deal of your time, exhausted your energy and required that you sacrifice your everyday pleasures to reach your goal
· Overcome set backs, learn from mistakes and conquer your emotions
· Reach your goal with no regrets
If you have a pattern of starting and finishing projects, you are more likely to be successful in trading. If you have not, then your journey will probably be more difficult.
Brad was relentless
Many years ago a want-to-be trader by the name of Brad wrote me and asked if I would give him some advice about becoming a trader. He let me know that he did not have an education in trading and did not have any money. I sent him a letter that was not encouraging. Brad sent a second letter to me and said, “How would you have answered me if I had said I was wealthy.” With his new letter to me, I took the time to tell him to read books such as, Trading 101 and 102 by Sunny Harris.
Two years later Brad wrote me again to let me know that he was trading two hours a day and making money while maintaining a part time job. He said that he had studied over one hundred books on trading and was consistent in earning profits for the last year. Brad asked if I knew anyone who might consider hiring him as a trader. That day fortuitously, I had spoken to one of my clients who said that if I ran into anyone looking for a job as a trader, he would consider them.
The report I received from my client was that Brad impressed him by his knowledge, ambition and results. Brad was hired on the spot. My client paid for Brad to be coached by me, which took him to a new level of competence.
Long story short, Brad became my client’s best trader and now he is extremely successful. He did all of this while getting married, having a child and being in a wheelchair.
Conclusion
Those of you who will do whatever it takes can make your dreams come true, but you must consider the sacrifices versus the reward. If the reward ignites passion in you to the extent that you are willing to take on any challenge, then anything negative that anyone says will not deter you.
Free Monthly Newsletter
More Articles by Adrienne Toghraie, Trader’s Success Coach
Sign Up at – www.TradingOnTarget.com
Weekly Technical Review of Select Sector SPDRs
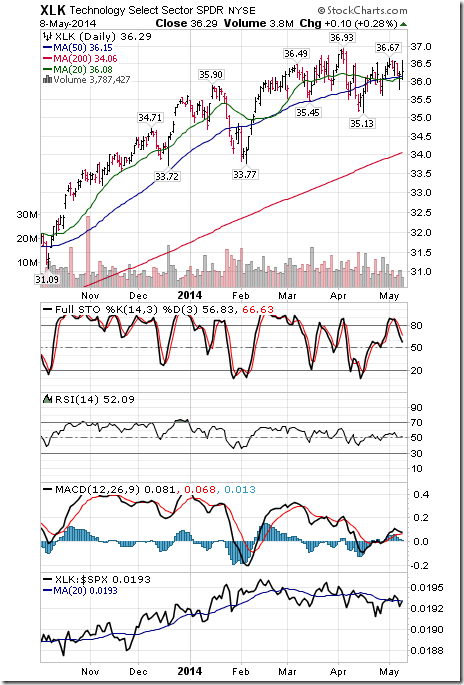
Technology
· Intermediate trend remains neutral (Score: 0.5)
· Units remain above their 20 day moving average (Score: 1.0)
· Strength relative to the S&P 500 Index remains neutral (Score: 1.0)
· Technical score based on the above indicators totals 2.5 out of 3.0
· Short term momentum indicators have rolled over and are trending down.
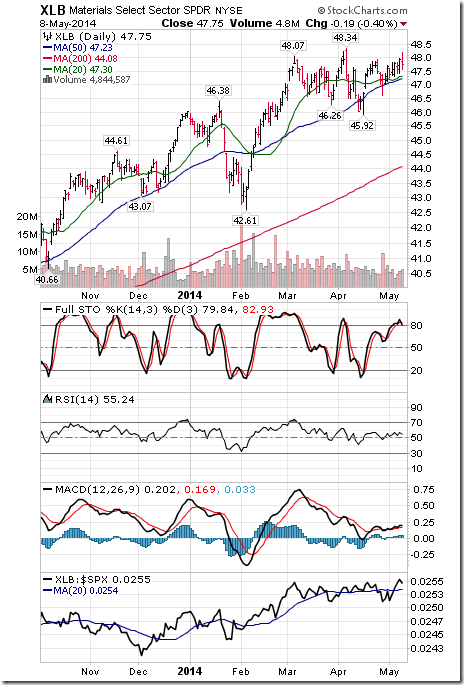
Materials
· Intermediate trend remains neutral
· Units remain above their 20 day moving average
· Strength relative to the S&P 500 Index changed from negative to positive
· Technical score improved to 2.5 from 1.5 out of 3.0
· Short term momentum indicators are trending up but are overbought
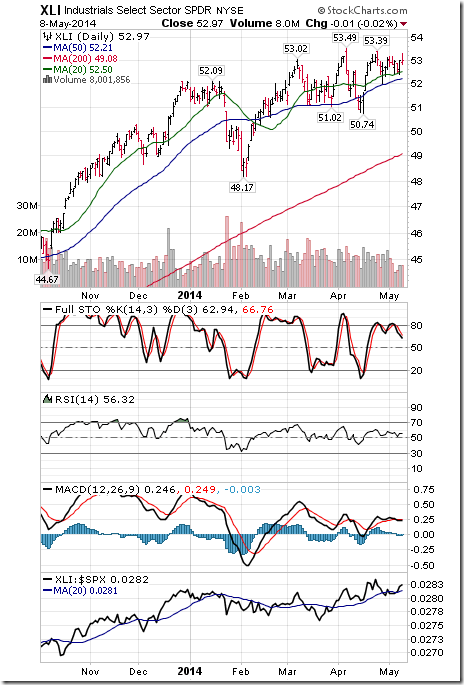
Industrials
· Intermediate trend remains neutral
· Units remain above their 20 day moving average
· Strength relative to the S&P 500 Index remains neutral
· Technical score remains at 2.0 out of 3.0
· Short term momentum indicators have rolled over and are trending down.
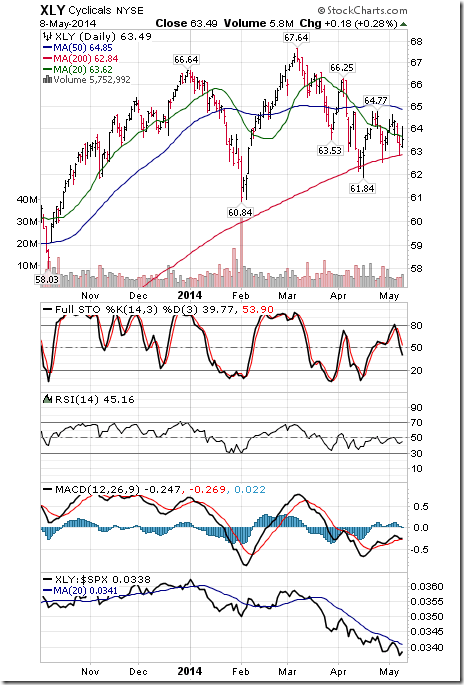
Consumer Discretionary
· Intermediate trend remains up.
· Units fell below their 20 day moving average
· Strength relative to the S&P 500 Index remains negative.
· Technical score fell to 1.0 from 2.0 out of 3.0
· Short term momentum indicators have rolled over and are trending down.
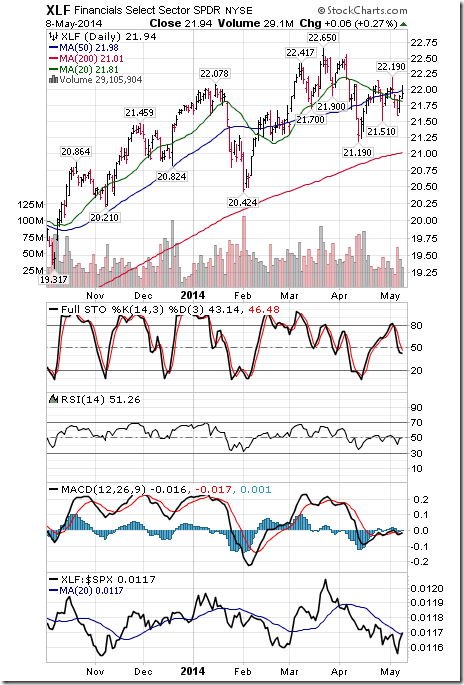
Financials
· Intermediate trend remains neutral
· Units remain above their 20 day moving average
· Strength relative to the S&P 500 Index changed from negative to neutral
· Technical score improved to 2.0 from 1.5 out of 3.0
· Short term momentum indicators have rolled over and are trending down.
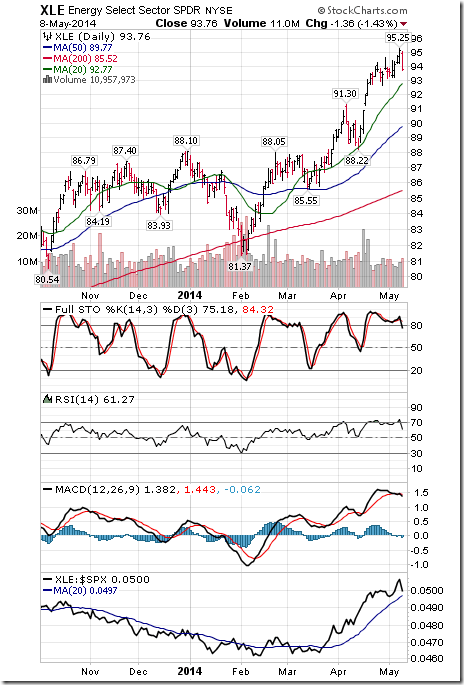
Energy
· Intermediate trend remains up.
· Units remain above their 20 day moving average
· Strength relative to the S&P 500 Index remains positive
· Technical score remains at 3.0 out of 3.0.
· Short term momentum indicators are rolling over and trending down.
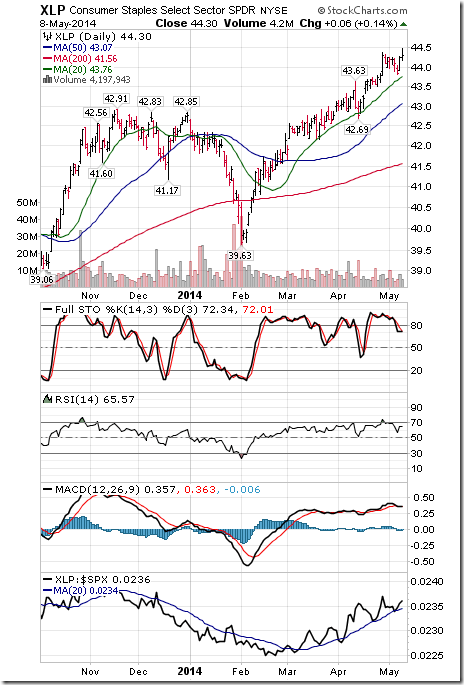
Consumer Staples
· Intermediate trend remains up.
· Units remain above their 20 day moving average
· Strength relative to the S&P 500 Index remains positive.
· Technical score remains at 3.0 out of 3.0
· Short term momentum indicators are overbought and trending down.
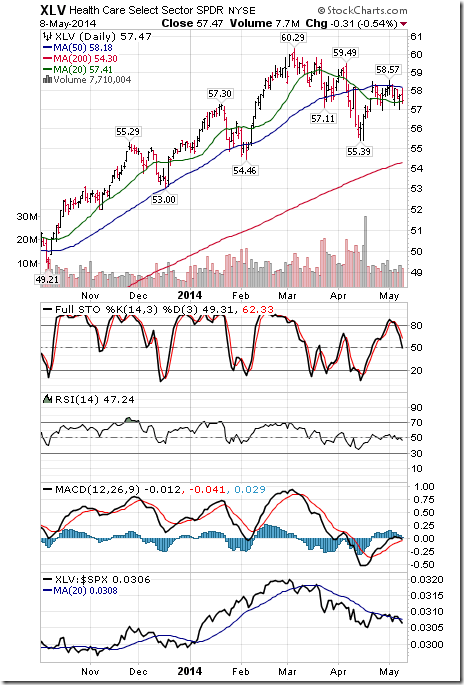
Health Care
· Intermediate trend remains down
· Units remain above their 20 day moving average
· Strength relative to the S&P 500 Index remains neutral.
· Technical score remained at 1.5 out of 3.0
· Short term momentum indicators have rolled over and are trending down.
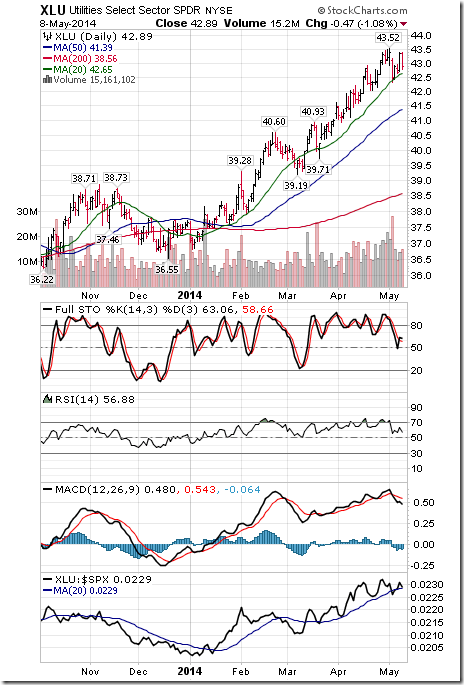
Utilities
· Intermediate trend remains up.
· Units remain above their 20 day moving average
· Strength relative to the S&P 500 Index changed from positive to neutral
· Technical score dipped to 2.5 from 3.0 out of 3.0.
· Short term momentum indicators have rolled over and are trending down.
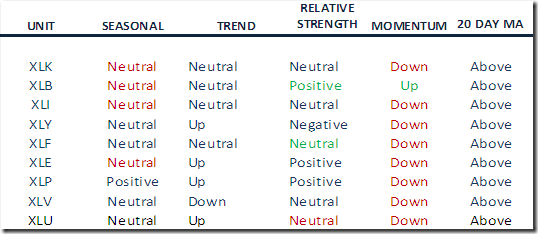
Summary of Weekly Seasonal/Technical Parameters for SPDRs
Key:
Seasonal: Positive, Negative or Neutral on a relative basis applying EquityClock.com charts
Trend: Up, Down or Neutral
Strength relative to the S&P 500 Index: Positive, Negative or Neutral
Momentum based on an average of Stochastics, RSI and MACD: Up, Down or Mixed
Twenty Day Moving Average: Above, Below
Special Free Services available through www.equityclock.com
Equityclock.com is offering free access to a data base showing seasonal studies on individual stocks and sectors. The data base holds seasonality studies on over 1000 big and moderate cap securities and indices. To login, simply go to http://www.equityclock.com/charts/
Following is an example:
S&P/TSX Capped Energy Seasonal Chart
^SPTTEN Relative to the S&P 500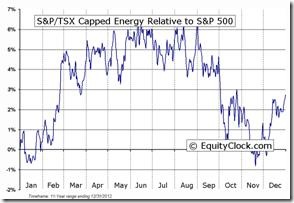 |
Disclaimer: Comments, charts and opinions offered in this report by www.timingthemarket.ca and www.equityclock.com are for information only. They should not be considered as advice to purchase or to sell mentioned securities. Data offered in this report is believed to be accurate, but is not guaranteed. Don and Jon Vialoux are Research Analysts with Horizons ETFs Management (Canada) Inc. All of the views expressed herein are the personal views of the authors and are not necessarily the views of Horizons ETFs Investment Management (Canada) Inc., although any of the recommendations found herein may be reflected in positions or transactions in the various client portfolios managed by Horizons ETFs Investment Management (Canada) Inc.
Twitter comments (Tweets) are not offered on individual equities held personally or in HAC.
Horizons Seasonal Rotation ETF HAC May 8th 2014
Copyright © Don Vialoux, Jon Vialoux, Brooke Thackray


