For this weeks SIA Equity Leaders Weekly, we are going to focus in on the TSX Composite as it has been the best performing equity market so far this year and Crude Oil. Will Canadian Equity continue its strong start to the year or is there any cause for concern going forward.
TSX Composite Index (TSX.I)
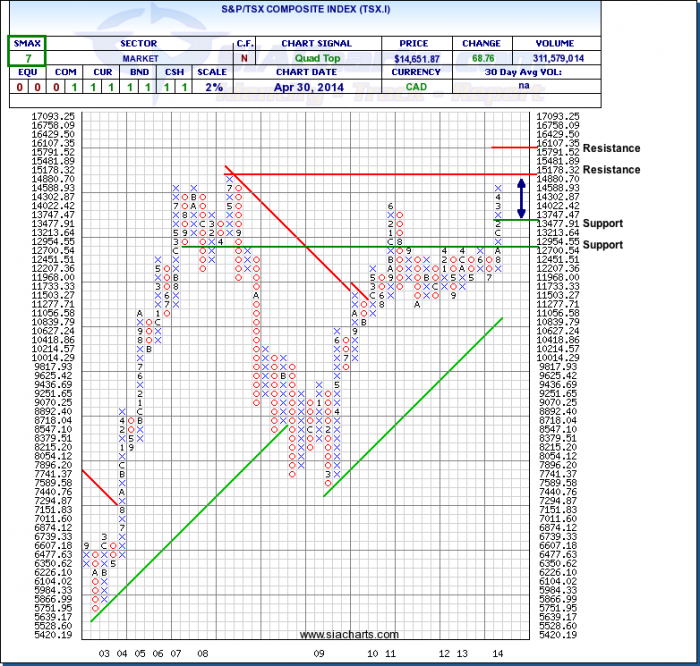
The TSX Composite has had a strong start to 2014 up around ~7.5% at the time of writing this article. We can see on a 2% point and figure chart that it has been in a column of "X's" without a pullback since August of 2013. It is now approaching the first resistance level at its prior high from July of 2008 at 15178.32. Should it move through this level, further resistance is found above at 16107.
Should this first resistance level hold which hasn't been challenged in almost 6 years, the first support level is found at 13477.91 and below this at 12700 if needed. TSX.I has an SMAX score of 7 out of 10, showing near term strength against all asset classes except equities. With continued strength showing in Canada, we want to keep a close eye on other important charts and influences like the currency exchange and commodity indices/futures to give us some insight on if this breakout in Canada will push through this resistance level to new highs or possibly have a short-term pullback.
Click on Image to Enlarge
Crude Oil Continuous Contract (CL.F)
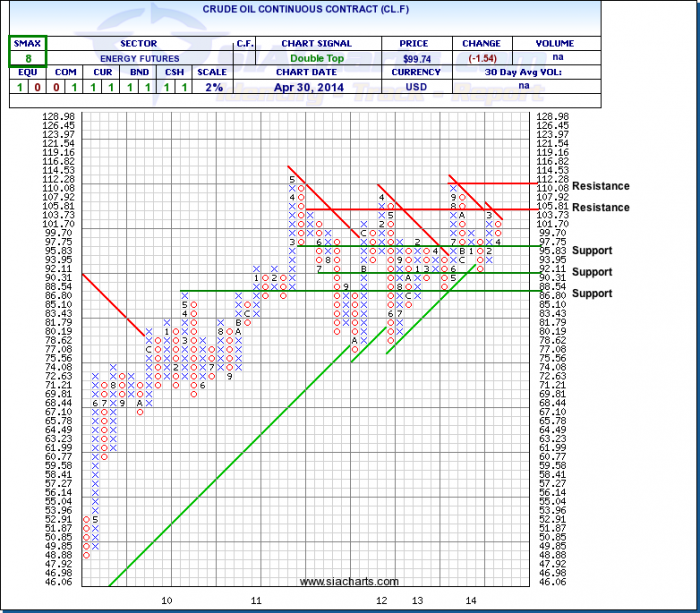
With the TSX Composite at new 5-year highs, it is interesting to note that at the same time, Crude Oil has been mostly flat to start the year as the futures contract is up around ~1.3% YTD at the time of writing this article. It has mostly traded in a range between $90 and $112 for the last couple of years. Crude Oil has now moved down to the first support level we highlighted last time at $95.83. Further weakness could see CL.F move towards support at $86.80. Should the first support level hold, resistance is found to the upside at $105.81
With the SMAX showing an 8 out of 10, Crude is showing short-term strength against the other asset classes. As crude oil is one of the primary commodities that drives Canada's economy, it will be interesting to see how much further the TSX can go if Crude cannot change its direction.
Click on Image to Enlarge
SIACharts.com specifically represents that it does not give investment advice or advocate the purchase or sale of any security or investment. None of the information contained in this website or document constitutes an offer to sell or the solicitation of an offer to buy any security or other investment or an offer to provide investment services of any kind. Neither SIACharts.com (FundCharts Inc.) nor its third party content providers shall be liable for any errors, inaccuracies or delays in content, or for any actions taken in reliance thereon.


