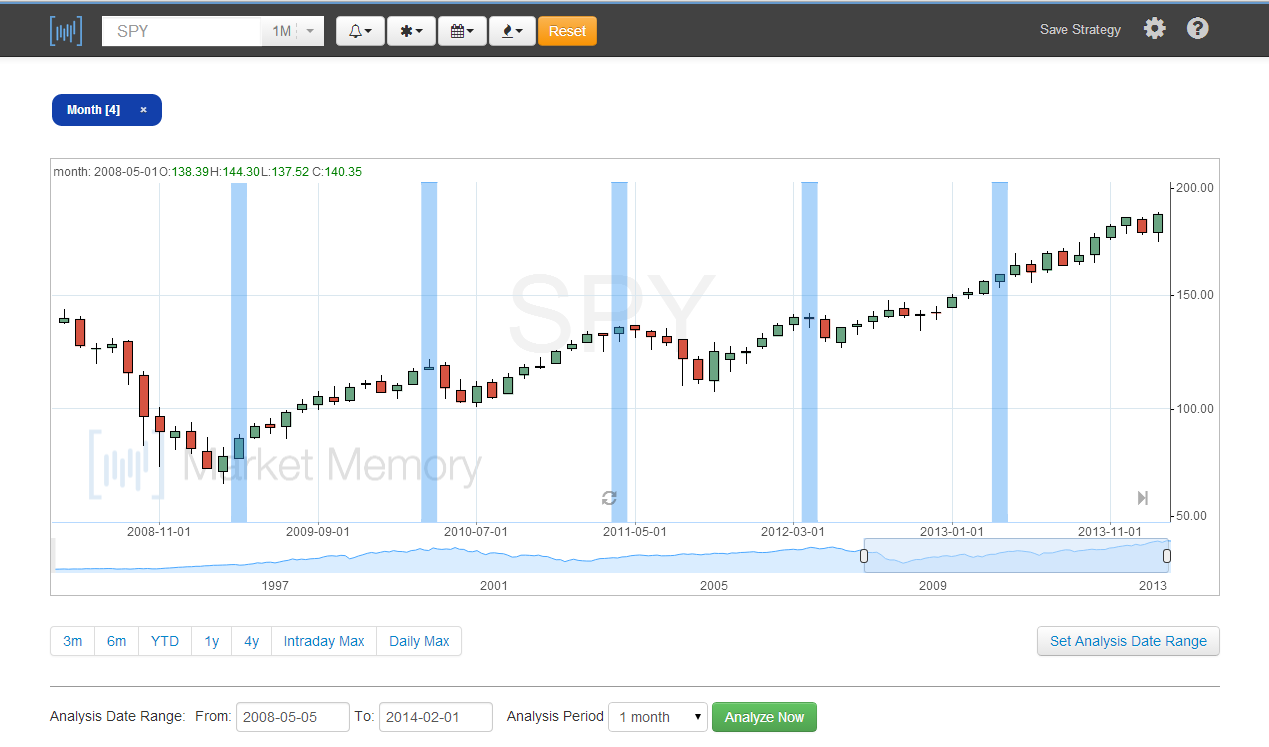
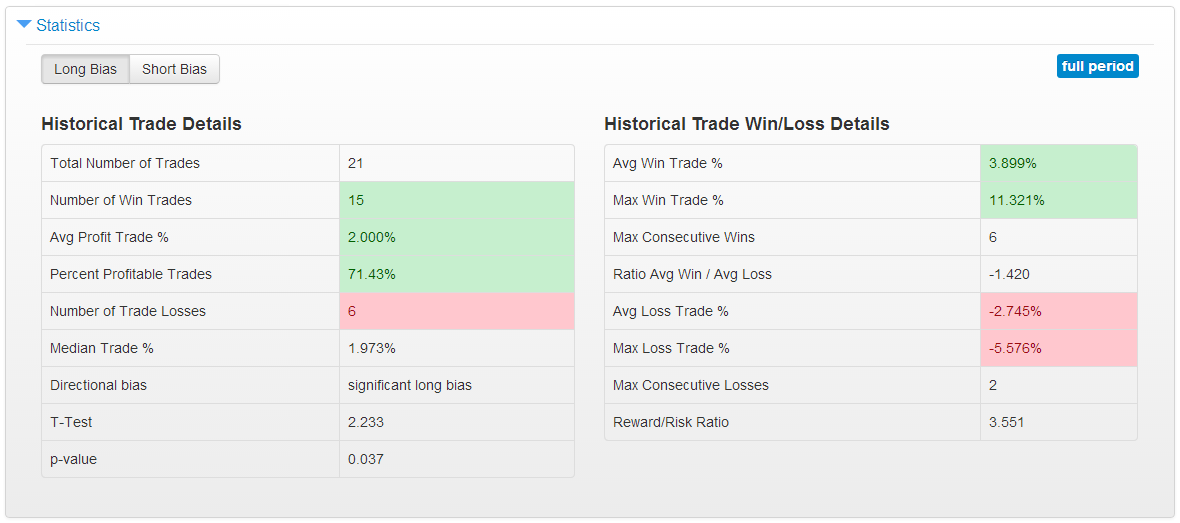
The spring is typically a very buoyant time for equity markets. When the market is in an uptrend, March and April have an almost perfect track record. In the long sample (since 1993), April has fared very well with 15 of 21 months posting a positive return.
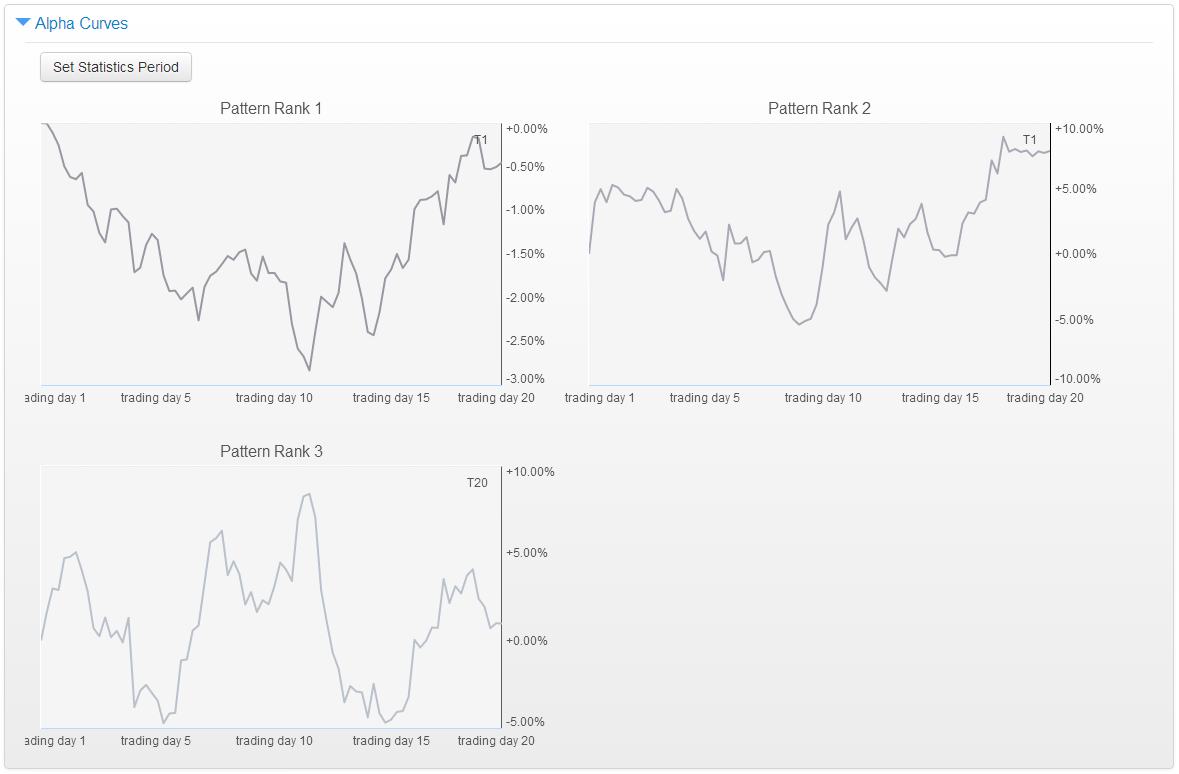
More recently (since 2008, see top chart for date range), the dominant pattern for the month of April is for some early month volatility followed by a second half rally. Notice in the Alpha Curves below and how both of the most dominant patterns have a dip and recovery. Now look at the tails for each of the highlighted months of April in the monthly chart — three of five have a lower candlestick tail larger than the body. The tail of the candle is formed by the intra-month pattern shown in the Alpha Curves. This anomaly is your April opportunity.
The market can do whatever it pleases and clearly enjoys upsetting most people most of the time. However, if you had taken this seasonal trade, more often than not you’d be better off. This analysis is designed to give you some perspective embed some intuition into the behavior of the market. This is just one opportunity and there are unlimited number of edges to be discovered.
Copyright © Dynamic Hedge


