Are Bonds Preparing to Weaken?
The bond market has been the star performer for 2014 with the 20+ Year Treasury Bond ETF ($TLT) up nearly 6%. In January I discussed the bond chart I was watching and highlighted the positive divergence that had taken place in the Relative Strength Index. We saw bonds continue to head higher, outpacing the lackluster equity price action.
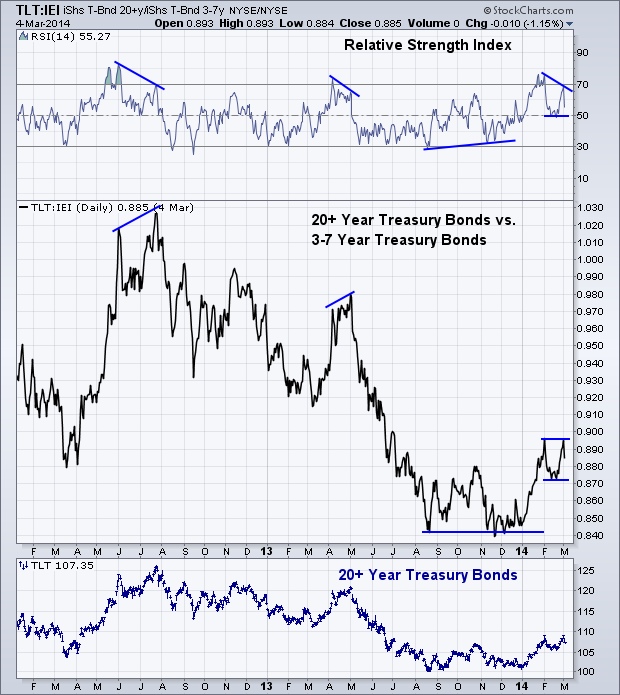
Today I want to discuss the same chart, but this time look at the negative divergence that is starting to play out. In July ’12 and April ’13 we saw the ratio between long-duration bonds ($TLT) and short-term duration bonds ($IEI) begin to see a divergence in momentum. The Relative Strength Index was heading lower as the ratio which showed $TLT outpacing $IEI make a higher high. This divergence ended up starting a period of weakness for Treasury bonds, as shown in the price action of $TLT in the third panel of the chart.
This same type of divergence between the ratio of $TLT and $IEI is taking place right now. We saw the RSI indicator break above 70 but unable to hit ‘overbought’ status again as the ratio met the previous high. What I’ll be watching now is whether the previous low in momentum gets taken out. If 50 can’t hold for the RSI as support then I would expect to see weakness enter into bonds, which as the third panel shows – hasn’t been good news for $TLT.
However, if we see the momentum indicator hold support and the ratio takes out the previous two highs at 0.89 then we may be able to see the bulls bond trade continue. I’ll let price lead the way.
Disclaimer: Do not construe anything written in this post or this blog in its entirety as a recommendation, research, or an offer to buy or sell any securities. Everything in this post is meant for educational and entertainment purposes only. I or my affiliates may hold positions in securities mentioned in the blog. Please see my Disclosure page for full disclaimer. Connect with Andrew on Google+, Twitter, and StockTwits.


