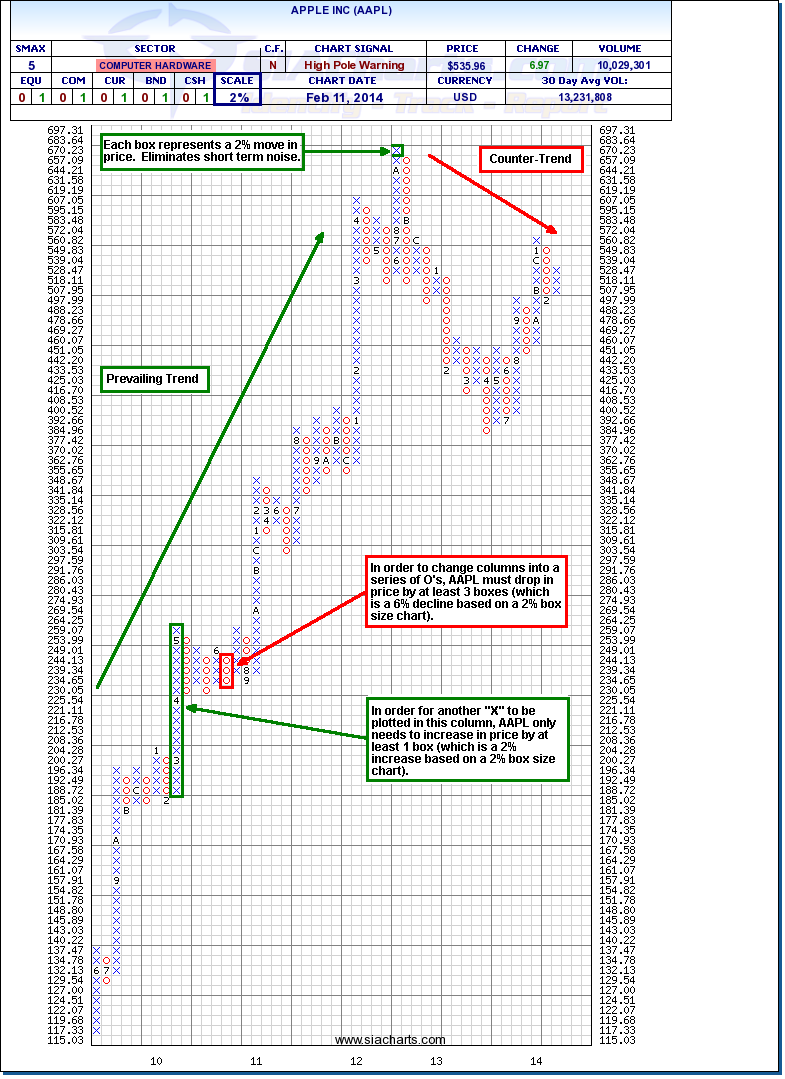
For this week's SIA Equity Leaders Weekly, we are going to discuss the importance of "Developing a Relative Strength Mindset" and what makes "Point & Figure Charts" so unique as a charting methodology vs all other forms of charting price movements. To do this, we will use Apple Inc.(AAPL) to help illustrate these concepts.
Relative Strength Mindset (AAPL)
"Developing a Relative Strength Mindset" is about understanding the "how" and "why" of Relative Strength ... specifically how it works and why it works! Some of the objections we often hear about Relative Strength is an investor will say that they purchased an investment in the Favoured Zone and it proceeded to drop in price or there were some whipsaws in and out of the Favoured Zone resulting in some quick buy & sell triggers, therefore it didn't work for me! The expectation for these investors is that buying a Top Ranked investment should immediately go up in price! When this doesn't happen they abandon the strategy and say it doesn't work! But the misunderstanding here is that the power of Relative Strength is in its ability to identify strong trends in an investment when they occur. The challenge is that we don't know in advance which investments are going to trend strongly either up or down. Sometimes an investment will whipsaw in and out of the Favoured & Unfavoured Zone, but the idea is that when it does trend strongly either way, this will eventually show up on our Relative Strength rankings and alert you to the possibility that this trend will continue. It is during these times when investments have a strong run that we really capture our superior performance results and avoid the large losses! Apple is a good example of how following its Relative Strength vs its peers within the SIA S&P100 Report enabled our subscribers to capture a 500% return while getting out before it dropped 30%.
Click on Image to Enlarge
Point & Figure Charting (AAPL)
Point & Figure Charts (PnF Charts) are truly unique among all charting methodologies, but this is not widely known or understood even within the Technical Analysis community. They are unique for 3 reasons:
1) PnF Charts only plot price movements, not time. So this provides an uncontaminated perspective of the supply/demand relationship of any investment. And since price movement is the result of an imbalance within the supply/demand relationship, PnF Charts are tracking the only metric that has a direct correlation to price action ... supply and demand!
2) PnF Charts only plots more significant price movements. For example, using a 2% scale box size, the chart will only be updated if the price of the investment moves by 2% or more. Any price movement less than 2% is simply considered "noise" and disregarded. Any trend reversals would also require a 3 box reversal, so in this case, the price would have to reverse by 6% (3 x 2%) in order for a new column of X's or O's could be plotted. This helps to filter out the price movements that are considered insignificant or "noise" and enables the advisor to focus on the longer trends.
3) PnF Charts provides a truly unique "asymmetric filter" in terms of the price action direction. If an investment is in a current column of X's, the price only needs to increase by the value of one box to generate a new X, but must fall by the value of three boxes in order to generate a reversal change to a column of O's. So, 3-box reversal PnF Charts are giving more emphasis to the current trend defined by the latest column of X's or O's, and ignoring any small reactions against that trend which are less than three boxes. This "asymmetric filter" is completely unique to PnF Charts! All other price-filtering systems are symmetrical, taking no account of the prevailing trend. This is how you can "Let your winners ride and cut your losses short"!
Click on Image to Enlarge
SIACharts.com specifically represents that it does not give investment advice or advocate the purchase or sale of any security or investment. None of the information contained in this website or document constitutes an offer to sell or the solicitation of an offer to buy any security or other investment or an offer to provide investment services of any kind. Neither SIACharts.com (FundCharts Inc.) nor its third party content providers shall be liable for any errors, inaccuracies or delays in content, or for any actions taken in reliance thereon.


