


With the recent market weakness/choppiness in the Equity Markets, for this weeks SIA Equity Leaders Weekly, we are going to focus in on both the S&P 500 and the TSX Composite and see what damage has been done, and compare it to some past pullbacks to see how this one compares.
S&P 500 Index (SPX.I)
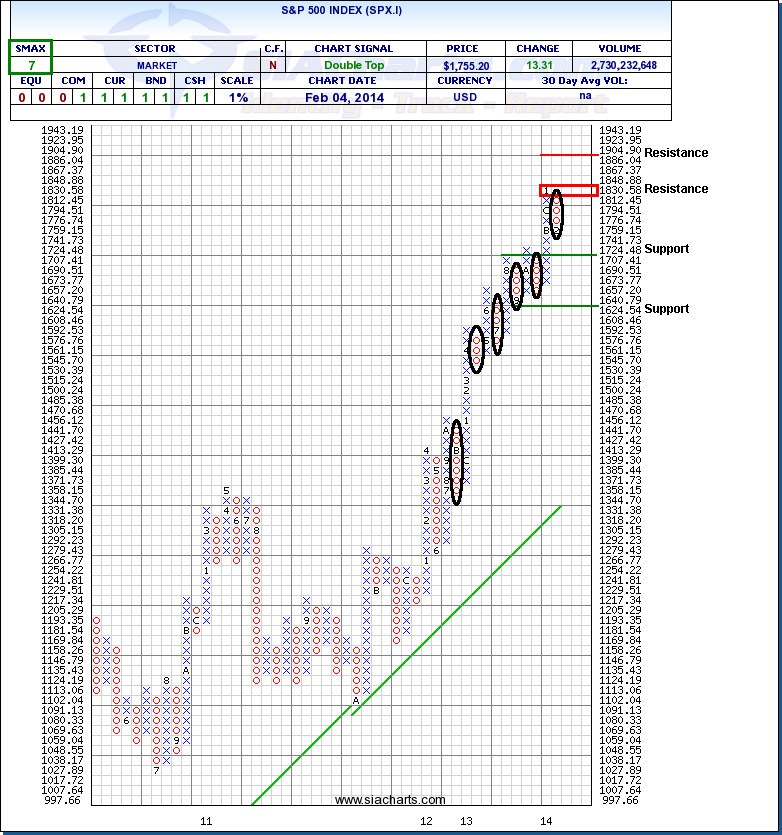
Usually we use a 2% chart when we are looking for support and resistance levels, but for this discussion today we are going to use a 1% to better illustrate what we need to look at, as on a 2% chart there has still been no reversal so far. Looking at the chart of the S&P 500 Index we can see that there have been 5 other previous pullbacks of at least 3% since the Equity Action Call last moved in to the Favored zone, with the largest of them being a 6% pullback back in November of 2012. At that time, the "experts" were commenting on how the market had run too far too fast, the market was now in a correction mode etc, and as you can see from the chart there have been several other pullbacks that have been similar to the one we are currently experiencing, with each prior one moving on to new highs afterwards. To date, this pullback is still a healthy, short term reversal like the others and we continue on with our rules based strategies.
Click on Image to Enlarge
TSX Composite Index (TSX.I)
Unlike the SPX.I above, the TSX Composite had been stuck in a multi year channel before finally breaking out to the upside in the final quarter of last year. But, like the SPX.I the pullback that we are currently experiencing is still small in comparison to several of the previous pullbacks that the index has seen over the past few years. At this point we can still consider this to be a healthy short term pullback and continue on business as usual.
What we need to remember is that we are now using a rules based system, and that going with our gut hunches or what the "experts" say really has not worked out for us in the past. Is it possible that this is indeed the high, and there is more downside ahead of us? Yes, it is possible, but thus far the Equity Action Call and the Asset Class Rankings continue to point us towards staying the course and remaining in those Equity positions.
Click on Image to Enlarge

SIACharts.com specifically represents that it does not give investment advice or advocate the purchase or sale of any security or investment. None of the information contained in this website or document constitutes an offer to sell or the solicitation of an offer to buy any security or other investment or an offer to provide investment services of any kind. Neither SIACharts.com (FundCharts Inc.) nor its third party content providers shall be liable for any errors, inaccuracies or delays in content, or for any actions taken in reliance thereon.
Copyright © SIACharts.com


