
January 6, 2014 by Liz Ann Sonders, Senior Vice President, Chief Investment Strategist, Charles Schwab & Co., Inc.
Key Points
- 2013 ends on a high note and with 2008 dropping out of the five-year returns, the "look back" period could leave investors feeling giddy (perhaps too much so).
- The economy has likely entered "escape velocity," but that brings a risk of tighter monetary policy or expectations thereof.
- The secular bull market is likely intact; but the risk of a correction this year is elevated (albeit one that is likely "buyable").
What a difference a year makes! At the end of 2012, the five-year "look back" performance for the S&P 500 was flat (up 9% including dividends). As of the end of 2013, that five-year total return jumped all the way to 126%. There are a lot of investors who are looking at their returns through year-end 2013 and feeling as good as they have in quite some time. One simple factor that caused the shift last year was the elimination of 2008 from the five-year span. Investors, when judging past performance, typically look at one-, three- and five-year spans. You can see the results of these for the S&P 500 back to 2000 in the table below. 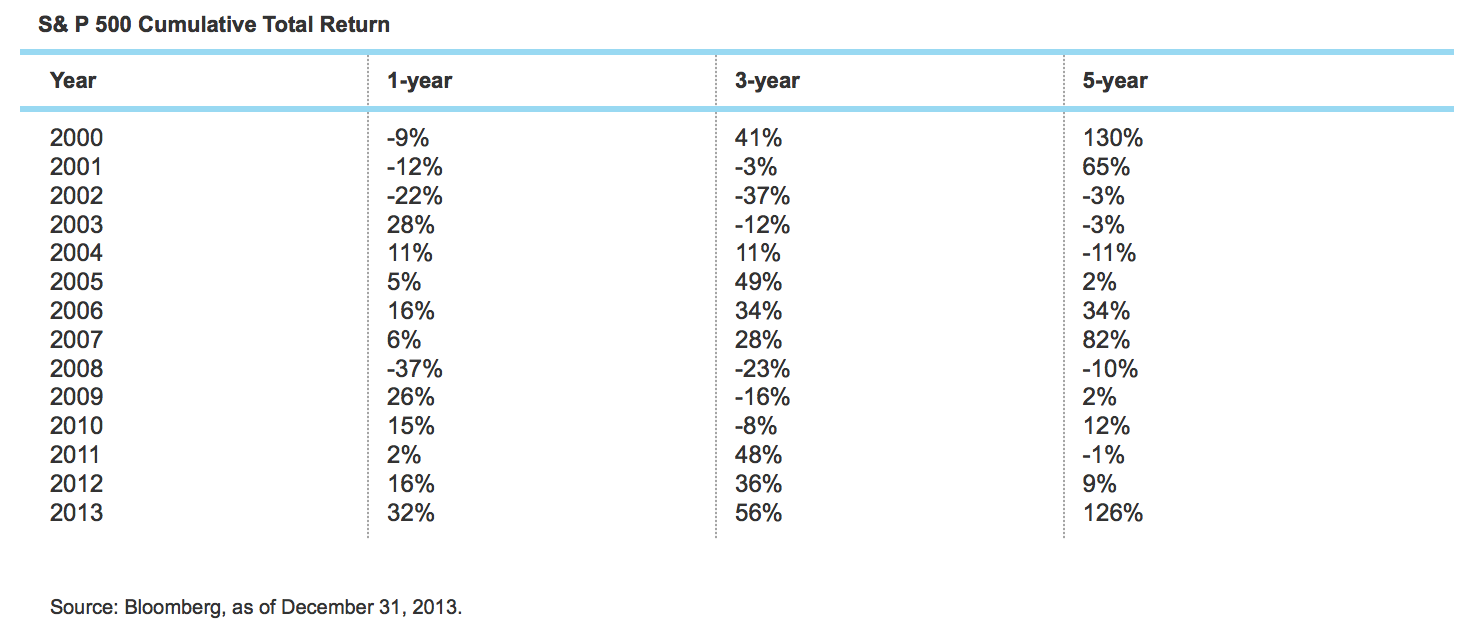 By the way, strong double-digit gains are not uncommon in S&P 500 history. In fact, single-digit gains are less common:
 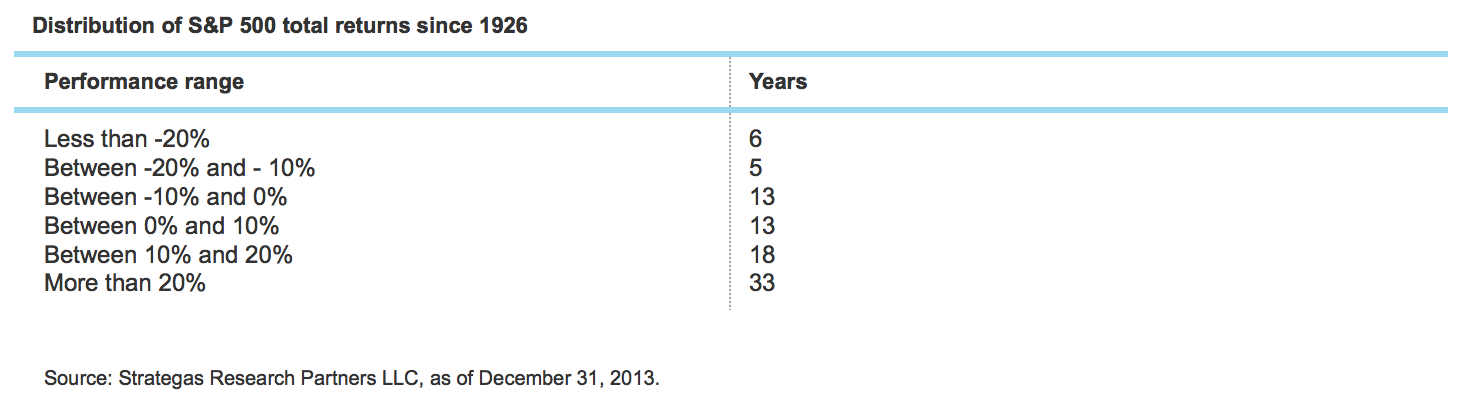 This bull market is now the sixth longest in S&P 500 history (of 26 total bull markets). As of year end 2013, it's run for 1,758 days, with the longest ending in 2000 at 4,494 days. It is the fourth strongest in history; up over 173% cumulatively as of year-end 2013. The strongest in history also ended in 2000, with a gain of over 582%. In terms of how the US stock market performed relative to its international brethren, as well as other major asset classes, see the ranking below for the full year 2013:
 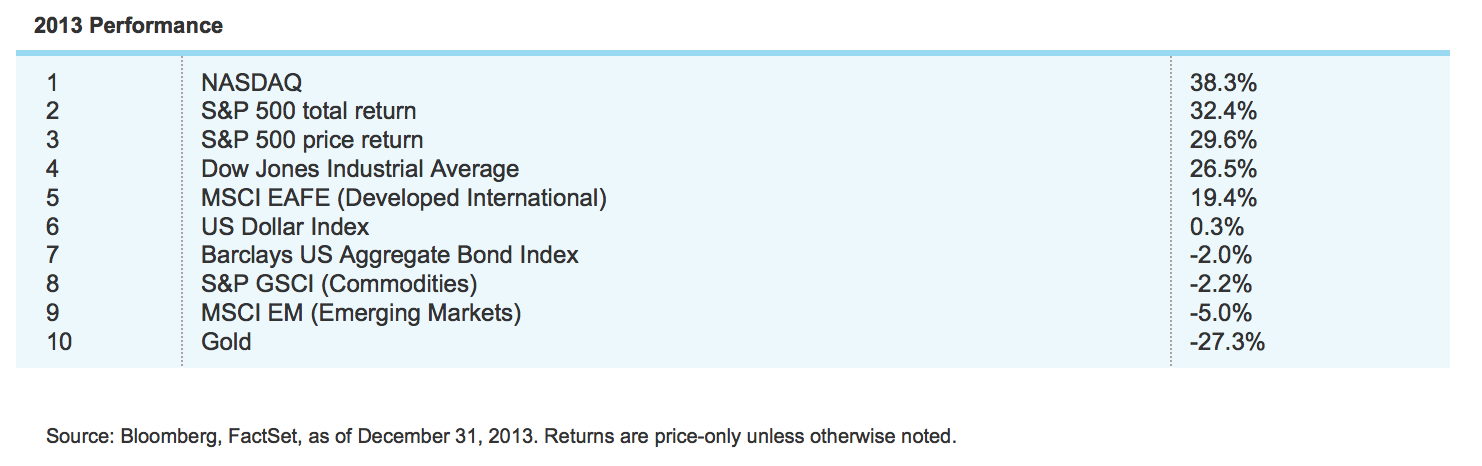 By the way, for the NASDAQ, according to The Bespoke Report, the average maximum year-to-date gain (over its entire history) in the year after a 25%+ gain was 26%. Assuming a repeat this year, that would take the NASDAQ above its March 2000 high of 5,134 at some point in 2014. Imagine that?! There were several unique characteristics of the past year:
- It was the fifth consecutive up year for the S&P 500. We've had two other five-year spans: 1995-1999 and 2003-2007; and one eight-year span: 1982-1989.
- The S&P 500 traded up the entire year in 2013, and was not down on a year-to-date basis on any day last year.
- The S&P 500's daily volatility was the lowest since 2006; with the market suffering only one correction of at least 5% (the least since 1995).
- The bond market (as measured by the Barclay's Aggregate Index) had its worst loss in 14 years; and was down for only the third time in 28 years.
- According to Ned Davis Research (NDR), within the Russell indexes, 2013 marked the first time since data began in 1985 in which each of the nine Russell styles (across capitalization and growth/value) gained at least 30%.
- According to BCA, going all the way back to 1870 (using the Dow), there were 30 years when the Dow's returns exceeded 25%; with 23 being followed by another year of positive returns (mean of 12%). So, based on history, there is a 77% probability of another positive year in 2014.
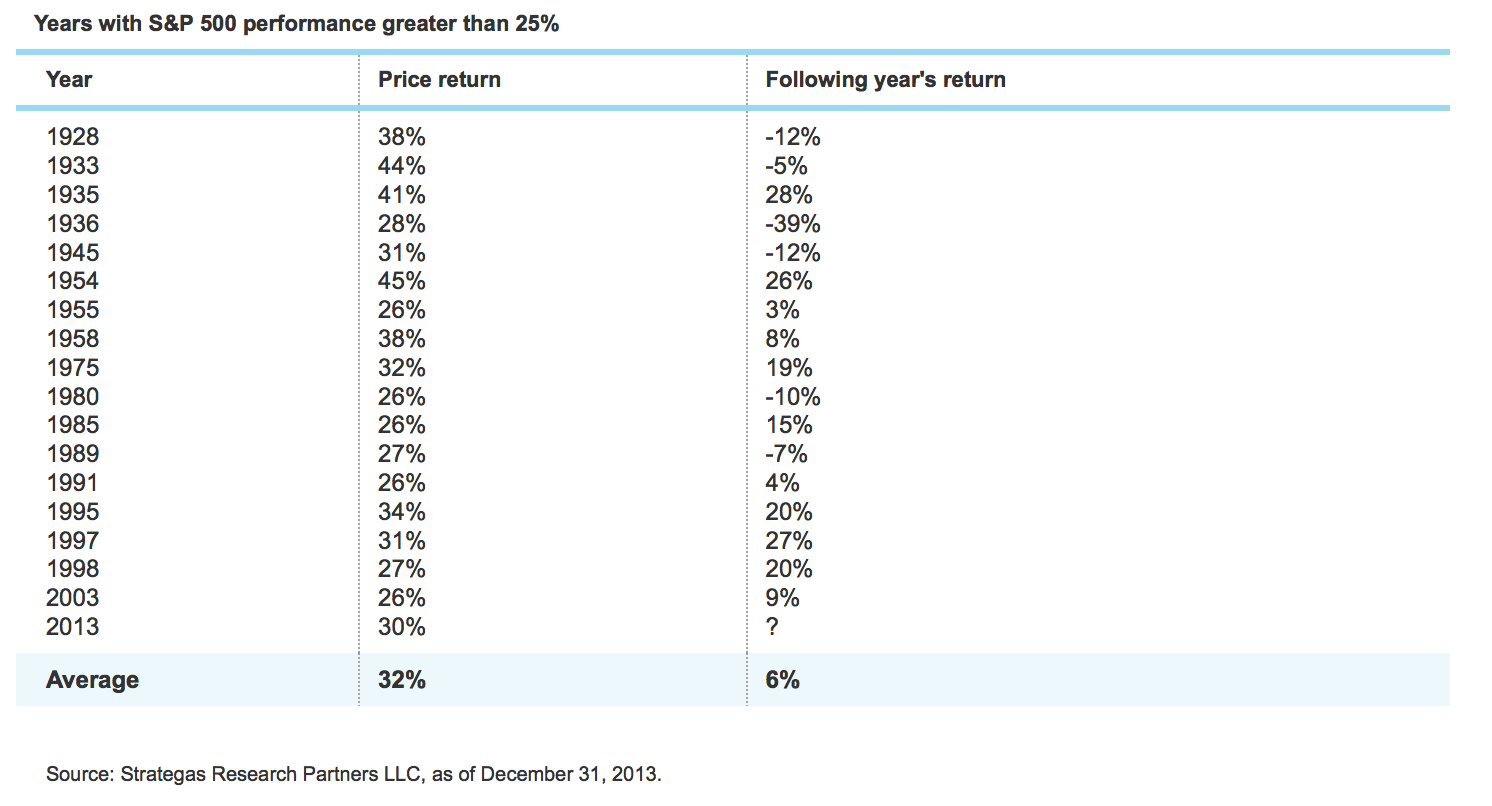
- It was the 18th year in S&P 500 history with a price return of over 25%. On average, the return the following year was a positive 6%; with the only doozy of a down year coming during the Great Depression in 1937 (see table below).
 The stellar return for US stocks obviously begs the question: What's next? We don't make attempts at precise forecasting a habit, because it's a fool's game; but I will share my thoughts on various scenarios for 2014's economic and market and economic. An early hurdle could be the first five trading days of the years posting negative returns; which tend to be perceived as negative omen for the year (but with a very imperfect track record).
Economic/monetary policy synopsis
In sum, we expect an acceleration in economic growth, led by a fading of fiscal drag—meaning government will no longer pull down gross domestic product (GDP)—as well as continued strength in housing and a pick-up in business capital spending (which correlates well with job growth). In fact, the economy could finally reach "escape velocity"—meaning the recovery moves definitively into expansion and doesn't require excess monetary stimulus. Instead, it is powered by consumer spending, business investment, housing and job growth. We also think political and Fed uncertainty will fade this year; barring a jolt of the unexpected by either. Schwab's team in Washington does not expect a repeat of last year's debt ceiling fight and/or government shutdown. And assuming there's no change in the late-2015 expectation for the first fed funds rate hike; a steady pace of QE tapering by the Fed (~$10 billion per month) is largely already priced into the market. Kathy Jones, Schwab's fixed income strategist, and her team, expect the 10-year yield to move up to about 3.5% this year; with upside to 3.75% if growth surprises on the upside. Finally, we believe inflation will remain tame; albeit ticking up this year from last year, if lending and job growth accelerates. Caveat to Fed uncertainty waning: Thank you Strategas for reminding us that there is "some evidence to suggest that the Fates do indeed like to see what the Chairman of the Federal Reserve is made of. Paul Volker was beset with the Iranian hostage crisis and a concomitant rise in the price of oil within three months of his taking the top job in 1979. Alan Greenspan had his hand on the wheel a mere two months before he was beset by Black Monday's 22% decline in stocks. And Chairman Bernanke had a little less than 18 months to settle into the job before he had to deal with the rumblings of an intergalactic financial crisis in the summer of 2007." Consensus views represent benchmarks per se; meaning surprises on either side of these expectations could unsettle markets this year. The consensus for real GDP growth in 2014 is less than 3%, while I believe the risk is to the upside. The consensus for inflation, measured by the core consumer price index (CPI), is for it to remain below 2%, which seems about right. The consensus for the unemployment rate is for a slow move down to 6.6% by this year's fourth quarter; but I believe the risk is to the downside (i.e., a lower unemployment rate). Although I don't think inflation is set to rise rapidly, if the unemployment rate were to move down more swiftly than expected alongside stronger economic growth, it could have implications for inflation and rates … and monetary policy and/or expectations thereof. This could be a catalyst for a sharper correction than would otherwise be likely. Leaving economic and policy fundamentals aside, the biggest risk in 2014 could be psychology- and/or valuation-related.
Stock market opportunities/risks
I remain optimistic about the market in 2014 thanks to the aforementioned interplay between an economy in expansion mode and still-easy, but normalizing, monetary policy. But it would also be foolish not to be mindful of complacency, given that valuations moved sharply higher over the past two years, and investor sentiment is showing elevated optimism (a contrarian indicator).
Presidential cycle
At this stage, there are few major warning signs of impending doom, but there are some things that bear watching this year. The first is the presidential cycle. This is the second year of the four-year cycle; the worst historically in the post-World War II period, as you can see below. And, for what it's worth, the second year's returns are even lower than the average when the president has been a Democrat. Presidential Cycle Source: Bloomberg, 1945-2013.
Valuation
Valuation is also on the watch list; although not yet overly troubling. At the end of 2011, the forward P/E was 12.9; and it expanded to 15.7 at the end of 2013. As such, the market was able to rise by about 50% over that two-year period, while S&P earnings growth was up "only" 12%. But the good news is, at least on a forward P/E basis, the market is not historically stretched, as you can see below. P/E Remains Below Norm Source: FactSet, Standard & Poor's, as of December 31, 2013. Even on a trailing earnings basis, the market remains below where it typically tops out at the end of bull markets, as you can see in the table below. 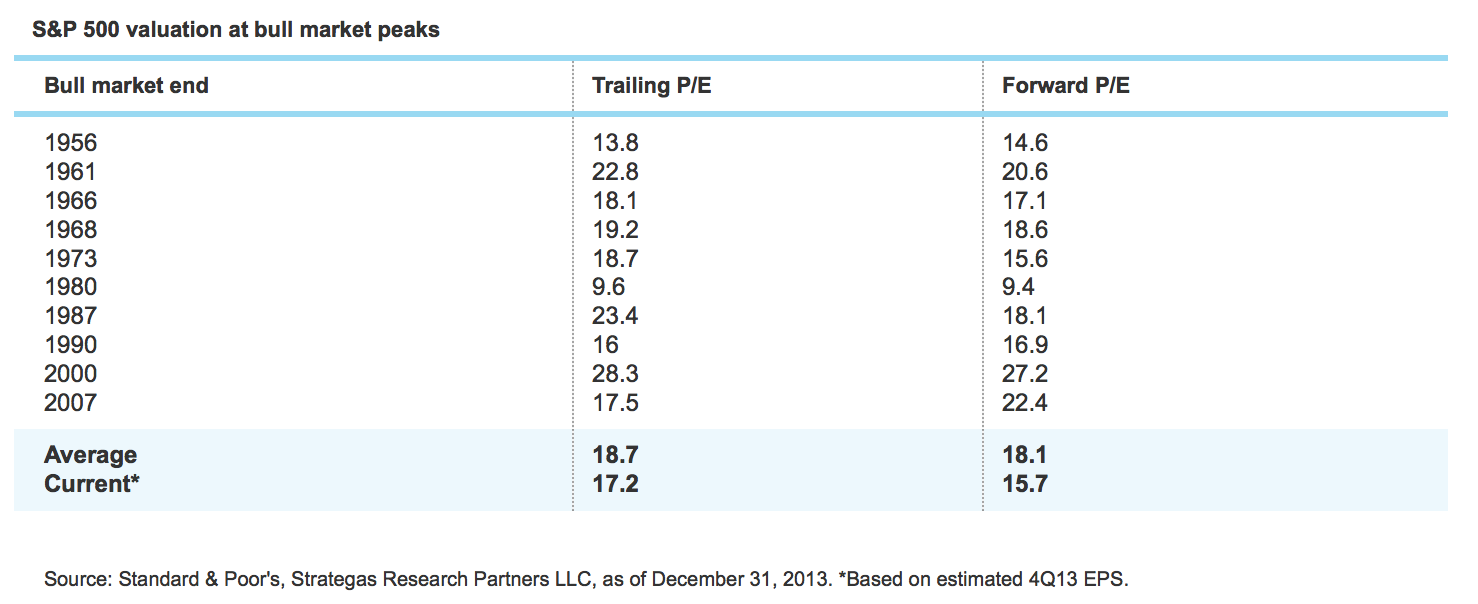 So, while the valuation story is not as compelling as it's been in recent years, it is not yet a major warning sign. The consensus for S&P 500 operating earnings is over $122 for 2014. An 18 multiple on those earnings would bring the S&P 500 to nearly 2200, Even if earnings don't reach $122 (and I'm skeptical they can, unless both US and global growth surprise on the upside), there remains a decent cushion for the market given still-reasonable valuations. Barring an actual contraction in earnings, it would be historically aberrant for the bull market to fully end; even if a correction is more likely.
Valuation expansion?
It's also possible valuations could continue to expand even if earnings growth doesn't meet expectations. There is a direct link between valuation and the yield curve. A steep curve (long rates much higher than short rates); which we have at present and are likely to maintain; suggests better growth and easy monetary policy. This environment typically co-exists with rising valuation. Low inflation is also supportive of higher multiples. Why? Earnings are simply more valuable when inflation is low; just like our earnings as workers are worth more when inflation is taking less of a bite out of them. Lastly, as noted in BCA's 2014 outlook report: In a liquidity trap, where interest rates reach the zero boundary, the linkage between monetary policy and the real economy is asset markets: zero short rates act to subsidize corporate profits, drive up asset prices and encourage risk-taking. Over time, higher asset values begin to stimulate stronger consumption and investment demand—the so-called "wealth effect." We could be at the very early stages of a broad transition from strengthening asset values to better spending power by businesses and consumers. Global capital spending has begun to show signs of a rebound; while US consumers are beginning to borrow and spend again.
Sentiment
It's sentiment that is giving me the most angst as we head into 2014. There are many sentiment indicators showing excessive bullishness; including NDR's Crowd Sentiment Poll, Investors Intelligence newsletter survey, and SentimenTrader.com's "Dumb Money/Smart Money Confidence Index." But there are also less exuberant measures as well; notably those from the American Association of Individual Investors (AAII). As you can see in the charts below; not only were there only two periods in 2013 when AAII bullish sentiment exceeded 50%, the longer-term 50-week moving average of that survey remains quite subdued. According to Bespoke, in the 251 weeks since the bull market began, the AAII bullish reading has only been above 50% 15 times. That's less than 6% of all occurrences! The "wall of worry" is intact. Short- and Long-Term Individual Investor Sentiment Source: American Association of Individual Investors, Bespoke Investment Group (B.I.G.), FactSet, as of December 27, 2013. If the market were to definitively move into "melt-up" status (something I've warned about for months), I would expect these more subdued measures of sentiment to become frothier; which would indeed be a warning sign. I want to end (somewhat positively) on a more direct measure of investor sentiment—which is what various investor cohorts are actually doing with their money. Attitudes have become much more optimistic, but actions often speak louder than words. Keep these facts in mind about how various investor cohorts are positioned:
- Domestic (US) equity mutual fund net cash flows ended 2013 in positive territory for the first time in eight years, with estimates ranging from $16 billion to $19 billion of inflows for the year. That, to some, is alarming (too frothy); but should be compared to the $548 billion that came out of those funds from 2008 through 2012!
- Bond mutual funds recorded their largest nominal annual net cash outflow ever in 2013, with estimates ranging from -$78 billion to -$88 billion of outflows for the year. That, to some, is also alarming; but should be compared to the $1.07 trillion that came into those funds from 2008 through 2012!
- At the beginning of 2013, traditional pension funds had more fixed income exposure than equity exposure.
- By the end of 2013, hedge funds' net long exposure (courtesy of ISI's survey) was only slightly above 50%; vs. prior highs of 60-65%.
- Over the past decade, endowments' traditional equity exposure has dropped from 50% to about 31% as of year-end 2012. Fixed income exposure is also down over the same span (23% to 11%). All the "action" has been in the catch-all category of alternative investments, which have jumped from 24% to 54% over the span. That category includes the likes of private equity, hedge funds and precious metals. Keep that in mind as you peruse the final table below.

In conclusion
I believe the secular bull market in US stocks is intact, but that there remains a risk of a correction in the near-term; especially if the market moves into melt-up mode (they don't end well). Other risks are the four-year presidential cycle and the possibility that the Fed has to become more aggressive if economic growth, inflation or employment surprise on the upside. A correction, which would be increasingly likely—especially if sentiment becomes overly frothy—could be nasty. But it would likely be a nice buying opportunity in the context of this ongoing secular bull market.