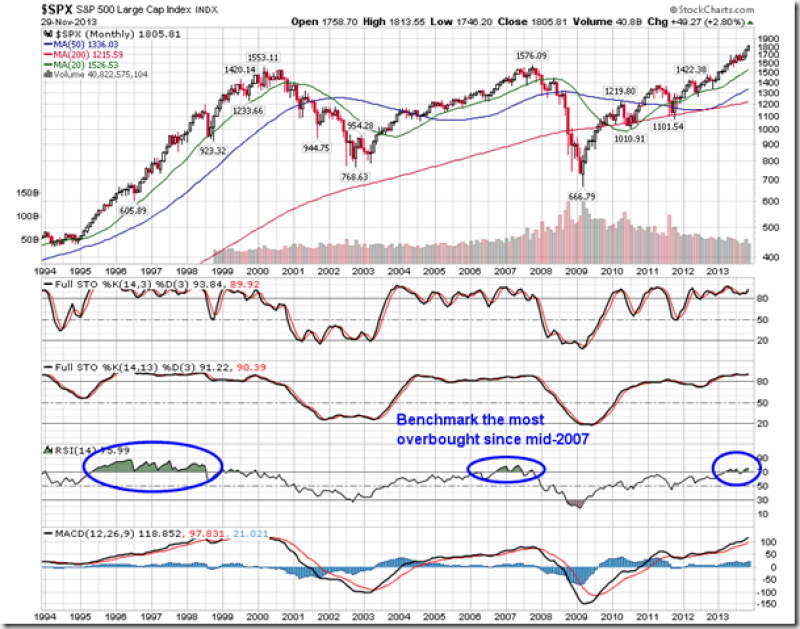
S&P Most Overbought Since mid-2007, but Signs of Peaking Not Evident Yet
by Don Vialoux, EquityClock.com
Upcoming US Events for Today:
- PMI Manufacturing Index for November will be released at 8:58am. The market expects 54.2 versus 51.8 previous.
- Construction Spending for September will be released at 10:00am. The market expects a month-over-month increase of 0.5% versus an increase of 0.6% previous.
- ISM Manufacturing Index for November will be released at 10:00am. The market expects 55.5 versus 56.4 previous.
Upcoming International Events for Today:
- German PMI Manufacturing for November will be released at 3:55am EST. The market expects 52.5.
- Euro-Zone PMI Manufacturing for November will be released at 4:00am EST. The market expects 51.5.
- Great Britain PMI Manufacturing for November will be released at 4:30am EST. The market expects 56.1.
- China Non-Manufacturing PMI for November will be released at 8:00pm EST.
The Markets
Stocks failed to hold onto early gains on Friday as month-end sell orders flooded the market during the last hour of trade in the holiday shortened session. The S&P 500 ended marginally lower by 0.08%. Still, over the course of the month, the large cap index added another 2.8% in what continues to be a strong year for equity markets. The monthly chart of the benchmark shows that the index is the most overbought since mid-2007, but signs of peaking are not yet evident. Momentum indicators continue to trend higher, along with the major moving averages, indicating continued positive pressures for equity prices. Support on this long-term view of the market would be expected around the 20-month moving average, currently at 1526, or almost 300 points lower than present levels.

And now begins the last month of the quarter and of the year. The month of December has been the third strongest month over the last 20 years. The S&P 500 index has averaged a gain of 1.5%, while the TSX Composite index has averaged 2.3%. Benchmarks on either side of the border have shown positive results in at least 16 of the past 20 December periods. The riskier small cap stocks tend to outpace the returns of larger cap counterparts over the period. The Russell 2000 Index has averaged a gain of 3.5% over the last 20 years, with positive results achieved in 18 of those periods. Top gaining sectors show a split between cyclical and defensive assets. Utilities have averaged a positive return of 2.5%, while Materials and Industrials have averaged a return of 2.2% and 2.3%, respectively. Both the industrial and utilities sectors have shown a frequency of positive results during this last month of the year of 80% of the time; materials, however, still remains slightly variable with a frequency of positive results of only 65%. Technology is the weakest sector, gaining 0.6%, on average; positive results were achieved in only half of the past 20 December’s. Gains for December, whether looking at the broad market or the individual sectors, are back-weighted towards the last half of the month during the notorious Santa Claus Rally period, which runs from December 15 through to January 3.
Returns for the S&P 500 Index:

Returns for the TSX Composite Index:

Returns for the Russell 2000 Index:

Seasonal charts of companies reporting earnings today:


Sentiment on Friday, as gauged by the put-call ratio, ended bullish at 0.81.

S&P 500 Index


TSX Composite


Horizons Seasonal Rotation ETF (TSX:HAC)
- Closing Market Value: $13.87 (down 0.36%)
- Closing NAV/Unit: $13.92 (down 0.05%)
Performance*
| 2013 Year-to-Date | Since Inception (Nov 19, 2009) | |
| HAC.TO | 9.43% | 39.2% |
* performance calculated on Closing NAV/Unit as provided by custodian
Click Here to learn more about the proprietary, seasonal rotation investment strategy developed by research analysts Don Vialoux, Brooke Thackray, and Jon Vialoux.

Copyright © EquityClock.com