by Eric D. Nelson, CFA
In case you haven’t noticed, there has been a surge in market forecasts lately claiming that the recent run up in prices has resulted in a stock “bubble”. There is no universal definition of what actually constitutes a bubble, so we’ll settle for the vague description of “a condition where market participants drive stock prices well above their value in relation to some system of stock valuation.” The fear of a bubble, of course, is that when the euphoria ends, prices will fall to more pedestrian levels resulting in a significant loss for existing investors who don’t bail out first.
Pundits have all sorts of valuation metrics they use to compare stock prices to historical trends—from simple one-year price/earnings multiples to “smoothed” ten-year earnings averages relative to price. But none of them provide much accuracy in terms of signaling the precise time to enter and exit the market. The best we can say about them is when valuations are relatively high, future returns may be a bit lower than average and vice versa.
Probably the best method of “bubble detection”, to the extent such a thing is even possible, is to simply observe an investment’s recent past performance history to measure how far in excess of the long-term average it has been. For example, Gold experienced a ten-year run starting in 1971 where it returned almost 32% per year. US small cap stocks earned 27% per year for the decade ending in 1984. And Japanese stocks produced over 28% per year returns in the 1980s. All of these results were well above long-term expectations and unsustainable, as each market eventually "reverted to the mean." Have we reached this point again?
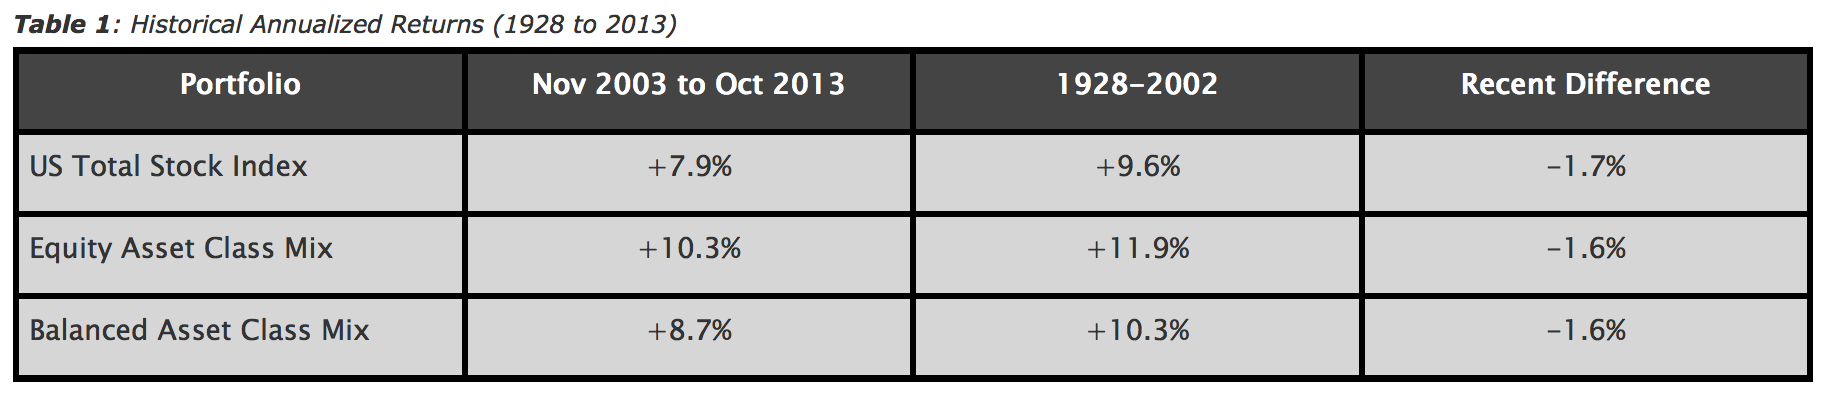
Table 1 looks at three different investment portfolios: a traditional US total stock index, followed by two more diversified asset class mixes—an all-stock allocation (“Equity”) and a balanced stock and bond combination (“Balanced”).
For the recent ten-year period, investment returns have been healthy despite the debilitating setback in 2008. The US Total Stock Index earned almost 8% per year. But this is far from an alarming rise in prices, as the average over the previous 75 years was 1.7% higher, at +9.6% per year. So far, so good. If lower-than-average returns have created a market bubble, that would certainly be the first time.
How about for more diversified asset class portfolios? They’ve certainly done better than a simple total stock index, but this has always been the case. In the recent period, the “Equity Asset Class Mix” earned a +10.3% annual return and the “Balanced Asset Class Mix” earned +8.7% per year. But these results were both 1.6% per year lower than their long-term historical average using US-only indexes due to availability. What hasn’t changed in either period is the spread of outperformance for the asset class mixes relative to the total stock index—about +2.4% in each period for the equity version, and +0.8% in each period for the balanced version. Of the two, arguably the more impressive result is the balanced mix. Despite its lower level of outperformance, it achieved this feat with about 40% less risk than the US Total Stock Index in each period.
Warren Buffet once said something to the effect that forecasts say more about the person making them than the actual claim itself, and that certainly holds true for bubble predictions. These are headline-grabbing claims that are sure to attract reader/viewership and more than a few worried individuals who will be pushed to act. But like all forecasts, these bubble warnings should be taken with a grain of salt. We have yet to develop a sure-fire method for predicting when the stock market will take a tumble. And even in cases where extreme and seemingly-excessive price increases do occur, they can continue for much longer than anyone would assume, rendering early action more costly than no action. In just the last two decades, for example, we've seen Nobel Prize-winner Professor Robert Shiller predict both the tech stock and real estate bubbles. Unfortunately, his first warnings were about five years early in each case, and we watched both those markets appreciate another 100% (in the case of the S&P 500 and REIT index) prior to eventually falling. In neither case did subsequent declines come close to retesting the market levels seen when his prognostications were first made.
As for the current state of the global equity markets, things appear to be pretty normal. Recent returns (last 10 years) have been about what we’d expect and within a small margin of error around the longer-term historical perspective. More diversified asset class portfolios have produced a sizable advantage over traditional total stock indexes, or produced similar returns with significantly less risk, but this too is par for the course. So simply put—talk of a stock market bubble is baloney.
Of course, following the worst calendar-year performance for stocks (2008) since the 1930s, recent five-year returns have been well above average. What does that say about the future? Stay tuned...
________________________
Source of data: DFA Returns 2.0
11/03 to 10/13
US Total Stock Index = Russell 3000 Index
Equity Asset Class Mix = 20% DFA US Large Company Fund (DFUSX), 20% DFA US Large Value Fund (DFLVX), 30% DFA US Small Value Fund (DFSVX), 10% each DFA Int’l Value Fund (DFIVX), Int’l Small Value Fund (DISVX), and EM Value Fund (DFEVX), rebalanced annually
Balanced Asset Class Mix = 65% Equity Mix, 35% DFA Five-Year Global Bond Fund (DFGBX), rebalanced annually
1928-2002
US Total Stock Index = CRSP 1-10 Index
Equity Asset Class Mix = 30% S&P 500, 30% DFA US Large Value Index, 40% DFA US Small Value Index, rebalanced annually.
Balanced Asset Class Mix = 65% Equity Mix, 35% 5YR T-Notes, rebalanced annually.
Past performance is not a guarantee of future results. The returns and other characteristics of the allocation mixes contained in this article are based on model/back-tested simulations to demonstrate broad economic principles. They were achieved with the benefit of hindsight and do not represent actual investment performance. There are limitations inherent in model performance; it does not reflect trading in actual accounts and may not reflect the impact that economic and market factors may have had on an advisor’s decision-making if the advisor were managing actual client money. Model performance is hypothetical and is for illustrative purposes only. Model performance shown includes reinvestment of dividends and other earnings but does not reflect the deduction of investment advisory fees or other expenses except where noted. Clients’ investment returns would be reduced by the advisory fees and other expenses they would incur in the management of their accounts. Past performance is not a guarantee of future results, and there is always the risk that an investor may lose money. Indexes are not available for direct investment.
- See more at: http://servowealth.com/resources/articles/talk-stock-market-bubble-baloney#sthash.KnkDFskY.dpuf