


by Dianne Lob, AllianceBernstein
Dianne F. Lob and Ding Liu
With the US stock market repeatedly reaching all-time highs in recent weeks, many investors are becoming leery of investing in stocks. Focusing on the market’s level is a mistake, in our view. It’s market valuation, not level, that matters.
Since 1900, the S&P 500 Index has been close to (within 5%) of its prior peak almost half the time. There’s a simple reason for this. The stock market goes up over time, along with the economy and corporate earnings. As a result, the market typically has regained its prior peak level fairly quickly after dropping. Then, it has resumed its upward march (Display 1).

Fear of investing at market peaks is understandable. In the short term, there’s always the risk that other investors will decide to take gains, or that geopolitical, economic or company-specific news will trigger a market pullback.
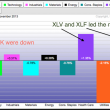
But for longer-term investors, market level has no predictive power. Market valuation—not market level—is what historically has mattered to future returns (Display 2).
 The green bars on the left side of Display 2 show average market returns after points at which the market level was close to its prior peak. The dotted line shows average market returns after all points since 1970 (we don’t have good valuation data before then). Over 1-, 3-, 5- or 10-year periods, annualized returns were about the same after points at which the market was close to its prior peak level as after all points since 1970.
Display 2 also shows that buying when the market was at least 5% below its prior peak level (indicated by the blue bars) didn’t help much. It added slightly to annualized returns over 1- and 10-year periods, but detracted from returns over 3- and 5-year time periods.
By contrast, buying at high valuations detracted significantly from returns—and buying at low valuations added significantly. The green bars on the right side of Display 2 show annualized average market returns for 1-, 3-, 5- or 10-year periods after market valuations were expensive, based on price-to-trailing earnings; they’re far below the dotted line that indicates showing the average for each period since 1970. The blue bars show returns after points when market valuations were low; the returns for these periods were significantly above average.
What does all this mean for investors today? The S&P 500 may be at an all-time high level, but it’s far below its all-time high valuation. At 18.7 times trailing earnings, the US market today is more expensive than average but it’s not extremely expensive (Display 3). Outside the US, however, equities haven’t rebounded as far, so the MSCI World Index of developed-market equities remains close to its long-term average valuation.
 But with interest rates still near historical lows, bonds are extremely expensive. Both US and global stocks are very attractively valued versus bonds, as shown by the earnings yield premium bars on the right side of Display 3.
While there’s always the risk of a market correction, we think long-term investors should invest in stocks at close to their strategic allocations. And, as always, it’s wise to diversify globally.
The views expressed herein do not constitute research, investment advice, or trade recommendations, and do not necessarily represent the views of all AllianceBernstein portfolio-management teams.
MSCI makes no express or implied warranties or representations, and shall have no liability whatsoever with respect to any MSCI data contained herein.
Dianne F. Lob is Chairman, Private Client Investment Policy Group at Bernstein Global Wealth Management, a unit of AllianceBernstein. Ding Liu is a Senior Quantitative Analyst at Alliance Bernstein.