Scott Minerd: Taper or Not, Stocks and Bonds Could Gain
November 14 2013
Both bond and equity markets are well-positioned, regardless of whether the U.S. Federal Reserve tapers its asset purchase program.
Global CIO Commentary by Scott Minerd
There is a fairly low chance U.S. interest rates will rise meaningfully in the near-term. Indeed, I expect yields will decline from the current level of about 2.7 percent on the 10-year U.S. Treasury note. U.S. housing activity stalls when interest rates reach 3 percent, and I maintain my view that there remains an absolute ceiling of between 3-3.5 percent for the 10-year Treasury.
The Fed has told us that its decision on slowing its program of quantitative easing (QE) will depend on economic improvement, and economic data has been and will likely continue to be mixed. The market, then, is driven by expectations about QE, but uncertain as to what indicator is most important. Having said that, however, there is one thing I can state with complete certainty: we will taper or we will not taper, and either path can lead to a bullish outcome.
If the Fed decides to taper its asset purchases, it will be because the U.S. economy is strengthening. A stronger economy translates into lower corporate default rates and tighter credit spreads. If the Fed does not taper, then the continued injection of liquidity into the economy will support prices for risk assets, and credit spreads will tighten.
Equities, as the first cousin of credit, face the same roadmap. If tapering occurs, then the economy is strengthening, and that should be good for earnings and also good for equities. Conversely, if tapering is delayed, all risk assets, including equities, will continue to be buoyed by QE’s added liquidity. International equities remain well-positioned for stronger gains and the recent reduction in the European Central Bank’s benchmark rate to an all-time low of 0.25 percent further enhances the outlook for European stocks.
Chart of the Week
U.S. Equity Valuations Not a Bubble Yet
The equity risk premium, measuring the excess return of equities over a risk-free rate, indicates that U.S. equities have not reached bubble levels. Falling from the extremely cheap level at 10 percent in September 2011, the S&P 500 equity risk premium now sits at 4.4 percent, above the historical average of 2.8 percent. With ongoing economic improvement and continued monetary accommodation from the Federal Reserve, the current bull market in U.S. equities, which started in March 2009, should still have room to run.
S&P 500 INDEX EQUITY RISK PREMIUM
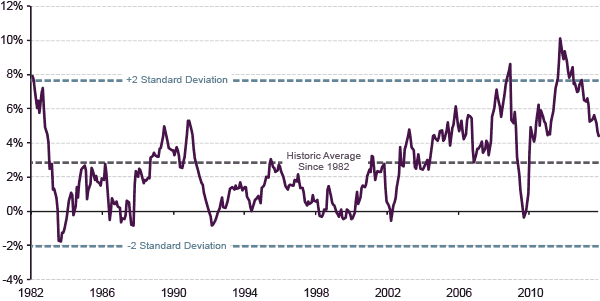
Source: Bloomberg, Guggenheim Investments. Data as of 11/14/2013. *Note: The equity risk premium is calculated by subtracting the risk-free rate (real 10-year Treasury yield as a proxy) from the earnings yield of equities (S&P 500 earnings yield as a proxy).
Economic Data Releases
Payrolls Surprise in Shutdown Affected Month, GDP Boosted by Inventories
- Non-farm payrolls increased 204,000 in October, much higher-than-expected. The prior two months were also revised up by 60,000.
- Despite the strong payroll report, the unemployment rate ticked up to 7.3% due to the largest household employment decrease since March 2009.
- Hourly earnings ticked up 0.1%, rising for a third consecutive month, and the workweek was unchanged at 34.4 hours.
- Third quarter GDP rose a better-than-expected 2.8%. Personal consumption was just 1.5%, the lowest in over two years. GDP growth was boosted by inventory accumulation, which added 0.8 percentage points.
- Personal income grew 0.5% for a second straight month in September.
- University of Michigan consumer confidence fell to 72.0 in November, the fourth straight monthly decrease.
- The NFIB small business optimism index dropped to 91.6 in October, the lowest level since March.
- Initial jobless claims fell 2,000 to 339,000 for the week ended November 9th. Claims have fallen for five straight weeks.
- The trade deficit widened to $41.8 billion in September, as exports failed to rise for a third consecutive month.
Euro Zone Growth Limps Forward, Japanese Economy Slows
- GDP in the euro zone ticked up 0.1% in the third quarter, the second consecutive quarter of growth.
- Euro zone industrial production fell 0.5% in September after a 1.0% rise in August. On a year-over-year basis, however, production turned positive for the first time in two years.
- Germany’s third quarter GDP rose for a second straight quarter but at a slower pace, up 0.3%, in line with estimates.
- German industrial production unexpectedly fell 0.9% in September after a 1.6% rise in August.
- German exports increased 1.7% in September, the best month since January.
- Third quarter GDP in France inched down 0.1% after rising 0.5% in the second quarter. Lower investment held back growth.
- U.K. retail sales, excluding autos, fell more than expected in October, down 0.6%.
- Chinese exports rose a better-than-expected 5.6% year-over-year in October after contracting in September.
- China’s industrial production accelerated slightly in October to 10.3% year-over-year growth, which was better-than-forecast.
- Japanese third quarter GDP slowed to an annualized growth rate of 1.9%. Net exports weighed on growth while investments made a large contribution.


