It is becoming increasingly obvious that we are seeing the disconnect between financial markets and the real economy grow. It is also increasingly obvious (to Citi's FX Technicals team) that not only is QE not helping this dynamic, it is making things worse. It encourages misallocation of capital out of the real economy, it encourages poor risk management, it increases the danger of financial asset inflation/bubbles, and it emboldens fiscal irresponsibility etc.etc. If the Fed was prepared to draw a line under this experiment now rather than continuing to "kick the can down the road" it would not be painless but it would likely be less painful than what we might see later. Failure to do so will likely see us at the "end of the road" at some time in the future and the 'can' being "kicked over the edge of a cliff." Enough is enough. It is time to recognize reality. It is time to take monetary and fiscal responsibility - "America is exhausted…..it is time."
Via Citi FX Technicals,
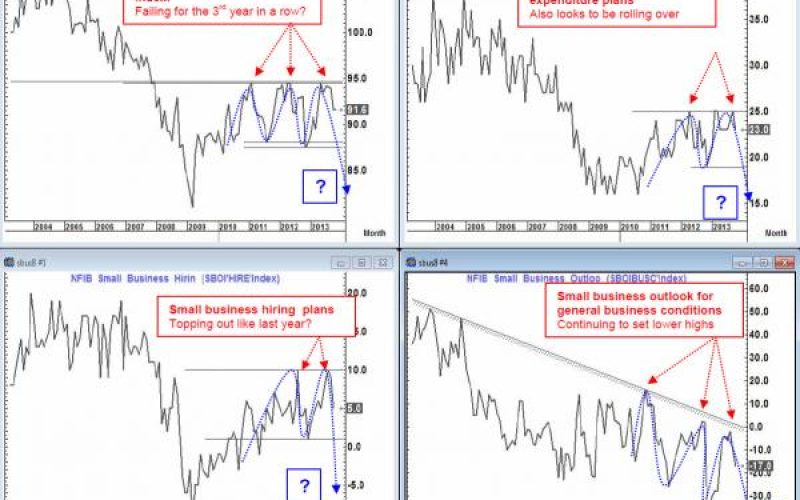
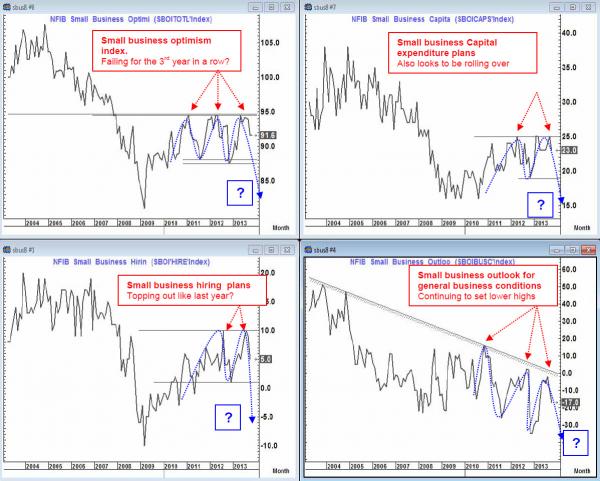
Small business (the “backbone of the US economy”) is struggling again
These numbers were released this week and give rise for concern. The outlook here does not look very promising as we see all of the charts above starting to look shaky
We are particularly focused on the overall small business optimism index and what it suggests.
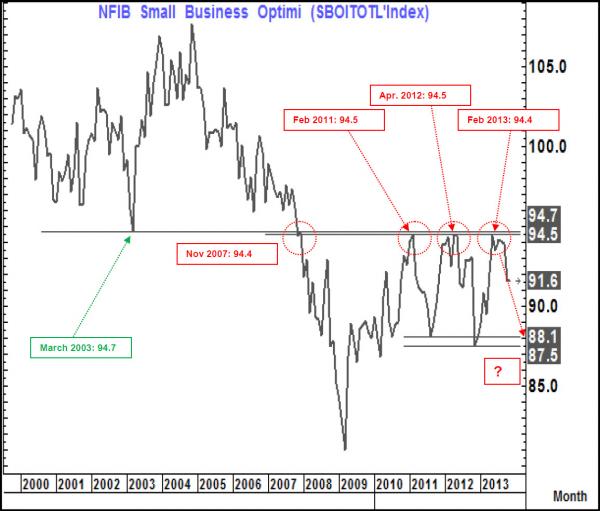
Small business optimism index
This chart is very compelling and looks to be following exactly the same path as that seen in 2011 (when QE2 was due to end only to “morph into operation twist”) and again in 2012 (when operation twist was due to end only to “morph” into “QE infinity”)
Important points to note on this chart are:
94.7: This was the major low posted in March 2003 (The month that the major rally in the stock market (S&P) began which then peaked in October 2007.That gave us a low to high move of 105%.) Traditional Fed easing ended in June 2003 with the Fed funds rate at 1%.This indicator then rallied to a peak of 107.7 by November 2004. The next time this support was revisited was in November 2007 when it gave way with a “print” of 94.4
94.5: This was the high of the bounce off the March 2009 low and was posted in Feb. 2011. The index then fell away and this high of 94.5 was once again posted in April 2012
94.4: After another fall away, this index again bounced into a peak of 94.4 in May 2013 and has since moved lower again.
After the break of supports in 2007 the low posted was 81 (March 2009) while we saw levels of 88.1 and 87.5 respectively after the 2011 and 2012 peaks. (The 2011 move took 6 months (Aug. 2011) and the 2012 move took 7 months (Nov 2012)). Operation twist was instituted in Sept 2011 while QE “infinity” was put in place in Sept 2012. If we were to follow the same path then the Fed could well be talking easing bias rather than tapering by the New Year (we hope not)
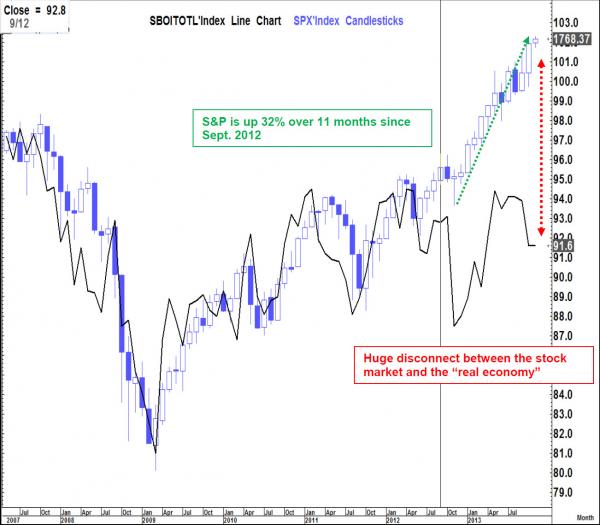
Overlay of the small business optimism index and the S&P 500
As can be seen from the chart above the Small business optimism index and the S&P were very correlated from 2007-2012. If anything, the Small business optimism index has tended to slightly lead i.e. the business backdrop seemed to reflect the economic backdrop which was then reflected in the equity market.
However, since Sept. 2012 when the Fed went “all in” with QE “infinity” there has been a huge divergence between these two. After an initial “hiccup” of about 9% in the Equity market it has since rallied 32% in 11 months, with no corresponding support from the business index.
There is now a “huge divergence” between the “backbone of the US economy” (Small business) and the Equity market. This clearly shows that while sharp balance sheet expansion at the Fed continues to “elevate” the equity market, it is far from clear that it is providing incremental benefit to the real economy. If these small business indicators continue to deteriorate as we expect then there is likely an inevitable negative feedback loop to the real economy and ultimately employment creation (Which at this point remains “qualitatively poor”)
If the Fed is not concerned about the dangers of creating a potential “bubble” in financial assets that does not see fundamental support, then they should be. They might want to explain what their next policy measure would be IF they allow a financial bubble to emerge while they sit at “Zero bound” short-term rates and a balance sheet likely sitting above $4 trillion.
The Equity market move is fundamental: Yeah right!
S&P and the Fed balance sheet since early 2009. Not at all correlated... well maybe a little
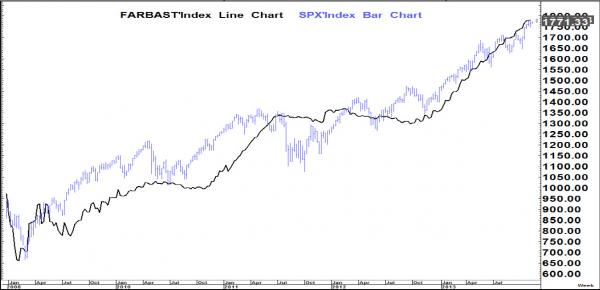
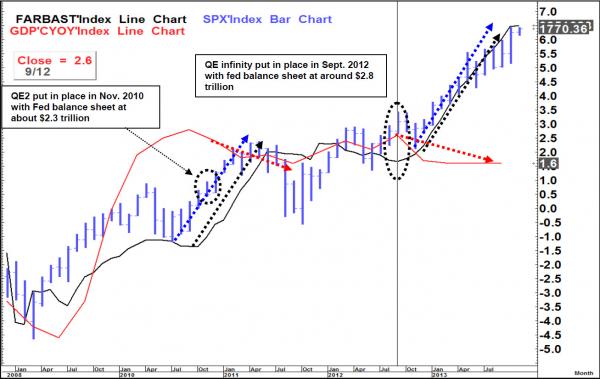
S&P, Fed Balance sheet and US GDP: QE infinity is working really well…..DUH..
Year on year real GDP growth peaked in 2010 at 2.8%.(YOY growth in nominal GDP peaked at 5.2% in 2012 and is now back at 3.1%). These levels remain extremely low by “normal” recovery standards and have failed to re-accelerate despite the fact that the Fed has nearly doubled the size of its balance sheet since 2010.
The Fed balance sheet is now $3.85 trillion and still rising.
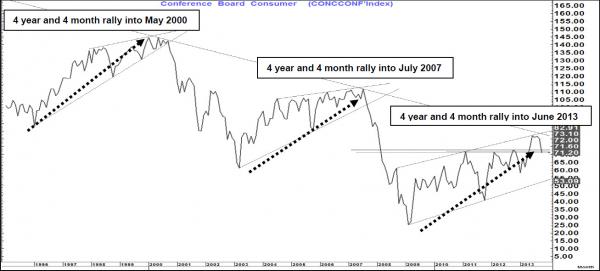
Consumer confidence chart further supports these concerns
Has rolled lower following the June 2013 peak and is now back below the 2011 and 2012 peaks.
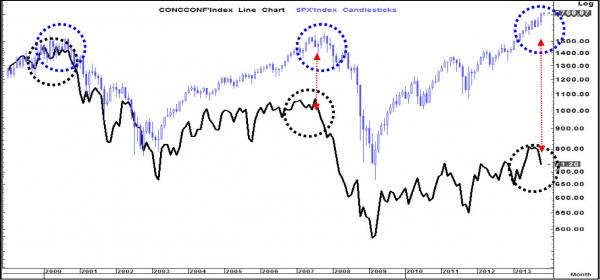
Huge divergence between consumer confidence and the S&P
Starting with 2000 and followed by 2007 and 2013 consumer confidence has hit a high followed by a lower high and another lower high.
At the same time the S&P has seen a high followed by a higher high and another higher high.
Effectively consumer confidence is acting like a momentum indicator and exhibiting “triple divergence” vis a vis the equity market
In 2000 there was a 4 month lag from when consumer confidence turned and the S&P began to struggle. In 2007 it was 3 months. So far there has been a 4 month lag (Consumer confidence peaked in June and so far the S&P has peaked in October at 1775).
It is also worth noting that the 1998-2000 rally (Which we think is very similar to today) in the S&P was 68%. A similar rally off the 2011 low gives us 1,806. In 2000 the peak of the S&P was also set at 14% above the 55 week moving average. Today such a gap would equate to 1,810 on the S&P. So there may still be a little “juice” left in this move into year end.
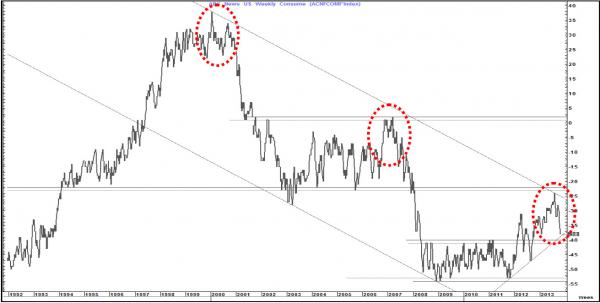
ABC news weekly consumer comfort index is now accelerating to the downside
As it did in 2000 and again in 2007. A move below minus 40 to minus 41 again would be concerning and suggest a danger of a return to the lows seen in 2008/2011.
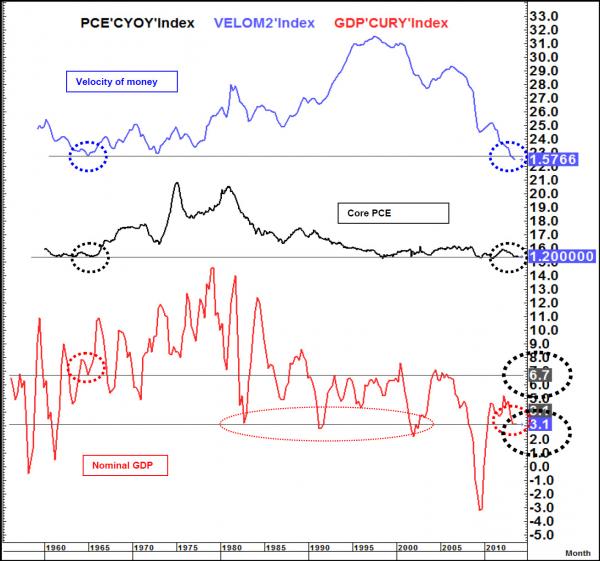
The velocty of money is extremely slow.
Subpar velocity of money leads to subpar economic growth leads to subpar job creation leads to downward pressure on inflation (disinflation)
We would argue that QE encourages excessive misallocation of capital into financial markets and thereby directly contributes a decrease/contraction in money velocity.
While velocity of money and core PCE are at levels identical to the mid 1960’s and similar to the early 1970’s nominal GDP (YOY) is much lower.
In fact nominal GDP is actually back to levels (troughs) similar to 1982, 1991 and 2001.
This is happening at the same time as financial assets are booming. This is just one of many charts that suggest that all QE is now doing is encouraging a misallocation of capital into financial assets thereby contributing to the lowest level in money velocity since the data series above began in 1959. This contributes to slow economic growth and poor “qualitative” employment creation as well as disinflation. (Transfers the inflation into asset markets like we did between 1980 and 2000) This argues that we should measure inflation as a combination of traditional economy inflation and financial asset inflation thereby “smoothing” the cycle instead of encouraging “booms and busts”
Will the above eventually encourage the Fed to adopt a nominal GDP target (i.e. to encourage more traditional inflation).If so, how do they hope to achieve that. We do not really know the answer but it seems increasingly obvious that QE is not it.
Meanwhile the employment backdrop remains “qualitatively” weak.
So given all of the above let us look at what we think should happen and also what we think will (unfortunately) happen
What should happen (In our view)
The Fed needs to hold their nerve and start tapering. This is less to do with the view of the underlying economic picture and more to the view that QE has become “destructive”. It encourages a misallocation of capital and poor risk management. As a consequence there is every chance that it contributes to a falling velocity of money as liquidity simply “round trips” in financial assets rather than multiplies out in the real economy. If the “trickle down effects” of the equity market were really happening then after a 166% rally in the S&P we should be “booming”. However, the “average Joe” in the US economy is more exposed to
- Credit- which is still tighter than in prior recoveries
- Housing- Which is recovering but at a much slower pace than previous recoveries
- Job creation- Which is recovering but remains “qualitatively poor”
It is quite possible (likely even) that this process will not be painless but that is not a reason not to do it. QE does not work and another way needs to be tried. The continued expansion of the Fed’s balance sheet simply encourages fiscal irresponsibility at a Governmental level in the misguided idea that the Fed will bail us out. If the Fed holds the line then Congress will be forced to address our issues head on, and that would be a good thing.
Throwing the “ball” into the fiscal arena would force Congress to look at ways to stimulate the economy in the near term but only if they address the “drag” on the economy of the long term fiscal promises that they cannot keep (i.e. reform entitlements, healthcare etc)
Fiscal stimulus and regulation reform (to make both more business friendly) would be a much more effective transfer mechanism in putting money in people’s pockets today. If combined with looking towards more business friendly policies it would potentially be a more effective “kick start” for the economy.
What about an HIA 2 (Homeland investment act) initiative to encourage repatriation of all those non-taxed corporate profits sitting overseas? A very low tax rate for these funds conditional on a robust framework for how that money needs to be used (Capex, infrastructure spending, job creation etc). This would be a fiscal stimulus that does not cost any money in the existing budgetary process (Surely that could attract a bipartisan approach). The tax received could also be used in similar areas.
A dynamic such as above (Less monetary easing/marginal tightening, combined with short term fiscal relief and long term fiscal reform would be unequivocally USD bullish in the medium to long term. Therefore a set of policies such as this would hugely strengthen our bullish USD view.
What likely will happen (In our view?)
The Fed will try to hold the line on tapering in the near term. Yellen will “do a Ben”. What we mean by that is that when Ben Bernanke was appointed he had a reputation of being “Helicopter Ben”. (A reputation that was obviously well deserved given the dynamics of recent years). However he spent his “early days” trying to establish his “dual mandate” credentials and “monetary responsibility” In fact he did this “to a fault” maintaining a “hawkish tone” in the first half of 2007 and suggesting the Fed might raise rates. They never did and the rest as they say is history. Yellen has a reputation for being a consensus builder and therefore in the “transition phase” it is likely that she will take a more balanced tone between the hawks and the doves. She may even concede some concern about the balance of positive/negative risks that QE brings (something we opined on above). In fact it is even possible that we get some tapering in the near term, possibly even in December.
What will matter as we see this tone and possibly action will be the reaction function of markets. IF yields push higher, IF Equity markets start to correct, IF housing numbers continue to moderate, IF emerging markets start showing stress again, will they hold the line and continue to steadily taper? We would like to think yes but a “Leopard does not change its spots”. Real GDP is very low by historic standards at this point in the cycle, official inflation (Core PCE) at the very low end of a 0.95% to 10.23% 43 year range (Stands at 1.2%) and the qualitative employment “recovery” is poor. We do not therefore believe that the Fed will “hold its nerve” if we get another negative reaction like we saw last summer to signals of imminent tapering.
In this instance it is far more likely (unfortunately) that they do not taper, or if they already have, that they reverse course and start to talk of other measures like inflation targeting/nominal GDP targeting etc. We hope not as we really think this would eventually be a strongly misguided and potentially disastrous course of action. History has shown that the longer an economy/market is subject to “interference” such that it becomes the norm rather than the exception then the worse the outcome eventually is. We cannot afford the danger of another 2000 or another 2007 in a zero bound interest rate environment and a Fed balance sheet potentially well North of $4 trillion.
Enough is enough. It is time to recognize reality. It is time to take monetary and fiscal responsibility. It is time to fix the excesses of the last quarter century+. It is time to take the pain today so that we can gain tomorrow. It is time to make this a better place for the next generation. Isn’t that what we are meant to do? That would be a much better legacy that that which are likely heading to if “Kick the can” remains the only “bankrupt” policy we have.
We honestly HOPE that this is the course we take. The US has a history of “finding a way”. As Winston Churchill famously said. “We can always count on the Americans to do the right thing, after they have exhausted all the other possibilities.”
America is exhausted…..it is time.


