Surprise, Surprise, Surprise!
by Dr. Scott Brown, Ph.d., Chief Economist, Raymond James
November 11 – November 15, 2013
The economic data were mostly stronger than anticipated last week. GDP growth exceeded expectations, although the details were a bit troublesome. With everyone anticipating some impact from the partial government shutdown, nonfarm payrolls accelerated in October. Moreover, revisions to August and September, painted a much stronger picture of job growth. What does this mean for the Fed and its decision to taper?
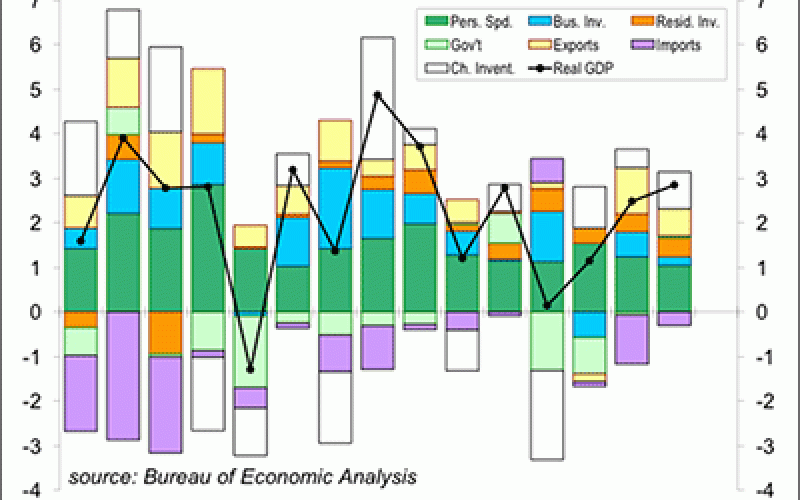
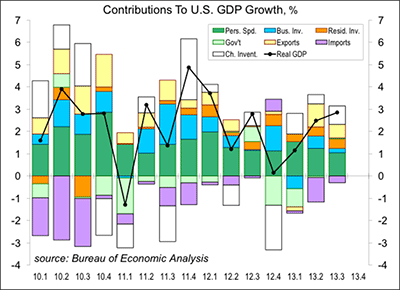
Golly! Real GDP rose at a 2.8% annual rate in the advance estimate for 3Q13, the strongest performance since 1Q12. However, consumer spending growth rose at a 1.5% pace and business fixed investment rose 1.6% – nothing to write home about. Residential home building continued to pick up; residential fixed investment added 0.4 percentage point to the headline GDP growth figure. Foreign trade added 0.3 percentage point (exports +0.6, imports -0.3). Government was about a wash, as a positive contribution from state and local government offset a negative contribution from the federal government (a theme that has also been reflected in the payroll figures). Inventories, which had risen at a relatively brisk pace in 2Q13, rose even faster. Recall that the change in inventories contributes to the level of GDP. So, the change in the change in inventories contributes to GDP growth. Faster inventory growth appears to have been unintentional, as domestic demand fell short of expectations. We’re almost certain to see slower inventory growth in 4Q13, which will subtract from GDP growth. There’s a major caveat to all this. The GDP figures will be revised on December 5 (and again on December 20).
The partial government shutdown had a mixed impact on the October employment figures. Bureau of Labor Statistics Commissioner Groshen indicated that “there were no discernible impacts” on the estimates of payrolls, hours, and earnings. However, there appear to be non-sampling errors in the household survey. Furloughed federal workers should have been classified as “unemployed on temporary layoff,” but many were apparently recorded as “employed, but absent from work.” The unemployment rate edged up only slightly (from 7.24% to 7.28%), but labor force participation fell by 0.4 percentage point, to 62.8%, while the employment/population ratio dipped by 0.3 percentage point, to 58.3%. The BLS reported that the labor force fell by 720,000, while employment dropped by 735,000, with 932,000 disappearing from the labor force. These are large numbers, reflective of the government shutdown, but don’t take them at face value. The household survey, which is based on a sample of about 60,000 households, generates unreliable estimates of levels (employment, unemployment). The estimate of the number of unemployed individuals, reported to have risen by 17,000 in October, is accurate to ±300,000. The household survey sample is, however, large enough to generate reasonable estimates of ratios, such as the unemployment rate (although that’s only accurate to ±0.2 percentage point).
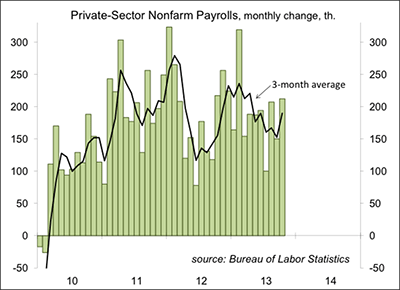
Shazam! Nonfarm payrolls rose by 204,000 in October, with a net revision to August and September of +60,000. Private-sector payrolls have averaged a 190,000 monthly gain over the last three months – a higher trend than expected.
For Fed policymakers, the recent data paint a mixed picture of the economy. The labor market has improved significantly since the Fed began its asset purchase program, but is that enough? The better picture of payrolls implies that a December tapering in the pace of asset purchases is not out of the question, but the decision to taper, as Fed officials have explained repeatedly, will be data-dependent. There will be one more employment report before the December 17-18 Fed policy meeting, but the Fed will have a lot to consider besides jobs. Higher long-term interest rates and a low inflation trend will be important factors.
Tighter Fiscal Policy Not Helping
November 4 – November 8, 2013
We are now more than five years into the economic expansion, but to many Americans, it still feels like a recession. Many of the headwinds that restrained the recovery early on, such as housing and state and local government, have turned to modest tailwinds, and monetary policy remains highly accommodative. The biggest restraint on growth this year has been fiscal policy. There is a near-term focus on a long-term budget deal, but an agreement seems rather unlikely. Sequester spending cuts set for mid-January should be a more important consideration for lawmakers.
We like to say that the downturn was not your father’s recession. It was more like your grandfather’s depression. Recessions that are caused by financial crises (as opposed to the Federal Reserve raising rates to check inflation) are a different animal. They are more severe, longer lasting, and the recoveries take a long time. Monetary policy attempted to minimize the downturn. The Fed and other central banks pumped liquidity into the system in a big way. We had some fiscal stimulus in 2009 and 2010 (the $831 billion American Recovery and Reinvestment Act), but the stimulus added only about 1.6% to GDP growth in those two years, hardly enough to offset a nearly 5% decline in domestic demand.
The drop in home prices has been, and will continue to be, a significant drag on consumer spending growth. About one out of five people with a mortgage remains underwater, owing more than the home is worth, but rising home prices should relieve some of the strain. Residential homebuilding normally accounts for about 4% of GDP. It rose to about 6% of GDP during the boom and fell to about 2% of GDP during the bust. It’s currently about 3% of GDP. Further improvement will add more to GDP growth over the next several quarters.
Government spending normally provides some base level of support during an economic downturn. However, this recovery differed from most in that state and local government was a major drag on growth in the first few years. Most state and local governments have balanced budget requirements. Tax revenues dry up as the economy weakens. To balance their budgets, these governments have to raise taxes or slash spending, both of which weaken the economy further. A third of the ARRA was aid to the states, but that wasn’t enough to offset budget pressures (although it may have dampened the pace of government job cuts). State and local government payrolls fell by 700,000 (or 3.6%) from late 2008 to late 2012. Tax revenues have improved as the economy has recovered (but are still far from normal), and state and local government is no longer a drag on overall GDP growth. In fact, it may begin to add slightly to growth over the next several quarters.
While the drag from state and local government has faded, federal government has become a larger restraint on GDP growth. The Congressional Budget Office estimates that the payroll tax increase and sequester cuts will shave a point and a half off of GDP growth this year. Granted, payroll taxes are meant to support Social Security and the 2 percentage point reduction in the rate over the previous two years created an imbalance. However, it could have risen more gradually. The payroll tax did not seem to have a big effect on consumer spending early in the year. That may be because most people were unaware that it had gone up. People will respond to a decrease in disposable income over time, however, and spending did appear softer in the spring and early summer.
The CBO estimates that the sequester cuts will subtract about 0.6 percentage point from GDP growth this year. Another round of cuts is set for January 15, which is likely to subtract about 0.4 percentage point from GDP growth in 2014. Sequester cuts have proved to be unpopular with both parties. That’s by design. The debt ceiling agreement in the summer of 2011 created a supercommittee that was supposed to come up with a long-term plan for deficit reduction. Failing that (and the committee seemed doom to fail from the beginning), the agreement would initiate across-the-board cuts to discretionary spending. The idea was that the sequester cuts would be so onerous (about half of discretionary spending is defense) that lawmakers would be forced to compromise. That didn’t work out so well. Both parties despise the sequester cuts but have been unable to come together to do anything about them.
The agreement to end the government shutdown calls for a bipartisan House/Senate commission to work on a long-term budget plan and report back to Congress by December 13. Republicans are not going to agree to tax increases and Democrats don’t want large cuts in entitlements. So it’s hard to be optimistic. However, lawmakers should at least be able to agree to kick the issue down the road, perhaps to the end of the fiscal year (September). Another partial government shutdown is unlikely. As part of the agreement to end the shutdown, the debt ceiling will be suspended until February 7, but Treasury can still use extraordinary measures to continue borrowing for weeks (and perhaps months) after that.
Federal spending has now fallen two years in a row and federal employment is at its lowest level since 1966. However, that reduction has come with a cost: slower economic growth. The key issue now is what to do about sequester cuts. There are growing reports of the consequences of the cuts that have taken place this year. However, it is likely to remain difficult for lawmakers to find a way around them.


