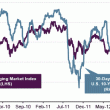
As the stock market has been rallying, oil and the dollar have really been struggling, and their chart patterns appear all but broken at this point. As shown below, oil was able to hold support at the $100 level for a couple of weeks, but once $100 broke a few days ago, the bottom has fallen out. Just today oil broke below its 200-day moving average for the first time since June 3rd, and it's as oversold as it has been since April.
The chart pattern for the US Dollar index looks even worse than oil's. Since the middle of 2013, the dollar has basically made a series of lower highs and lower lows, and yesterday we saw yet another breakdown below short-term support.
Another chart that is breaking down is the 10-Year Treasury yield. A few months ago, talk of the 10-Year above 3% was all the rage, but now it's back below the 2.5% level. On September 6th, the 10-Year yield pushed just above 3% to 3.005% for a brief moment, and since then it has done nothing but go down. Since the government shutdown and debt limit debate came to an end last week, the 10-Year yield has fallen 25 basis points. No default and no taper is a Treasury bondholder's best friend!
Copyright © Bespoke Investment Group


