For this weeks edition of the SIA Equity Leaders Weekly, we will be updating the key precious metals Commodities Gold and Silver. We have focused on these and other commodities quite a bit recently due to volatility so you have their potential trading ranges and future outlook versus other alternative Asset Classes and investments. Commodities overall have declined rather dramatically over 2013 while being ranked as the lowest asset class in the SIA Asset Allocation rankings.
Gold Continuous Contract (GC.F)
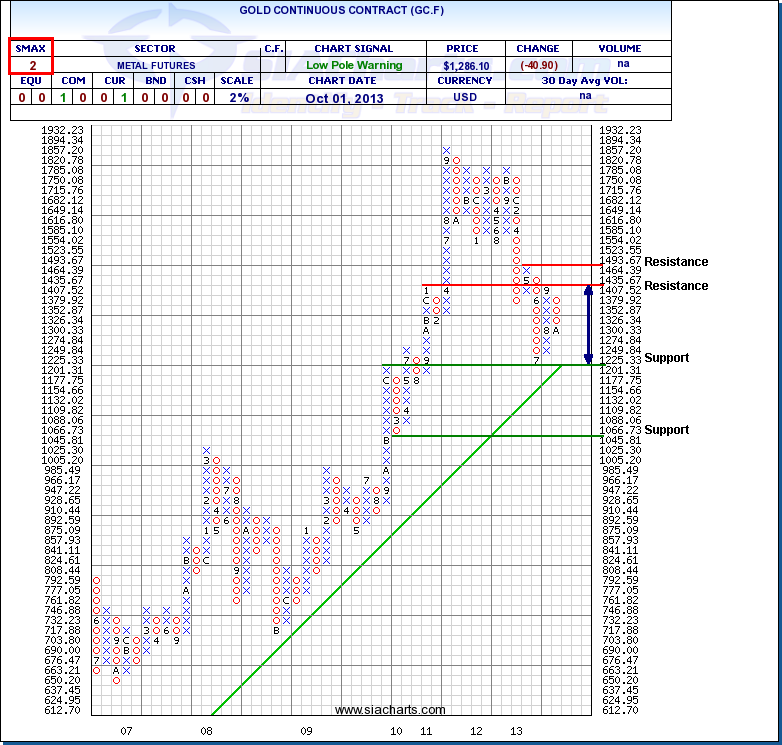
This is an update from the August 29th commentary we did on the Gold Bullion in the SIA Equity Leaders Weekly where we mentioned that Gold had some key resistance levels to take out at $1,435.67 and at $1,493.67 if it were to continue its rally. Since then, the resistance level at $1,435 held and over the past month reversed back into a column of O's on a 2% scale chart. Over the past two years now, Gold has not had a column of X's move higher than the preceding column's of O's as most of the positive rallies have been on the near-term and not ever fully recovered the prior losses.
For this reason, a trading range (shown by the blue arrow on the chart to the right) could be forming between these resistance levels and the low from July of 2013, which is now a support level. The key support level is still found at $1,201.31 which corresponds with the long-term upwards trendline. A break through this level could be substantial as the further support is not found until a 14% move below this at $1,045.81. Until these key resistance levels are taken out, the test ahead for Gold still has many potential technical hindrances which may want us to look for other opportunities elsewhere.
Click on Image to Enlarge
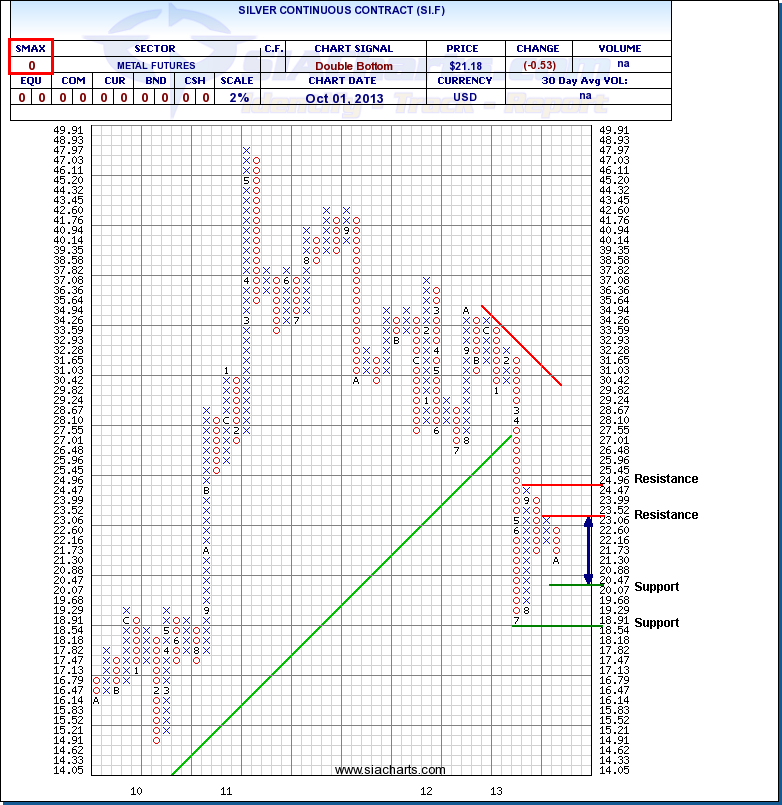
Silver Continuous Contract (SI.F)
Similar to the outlook we commented on Gold above, the Silver Continuous Contract (SI.F) has declined dramatically in 2013 losing approximately 32% in the first three quarters. Since we last looked at Silver Bullion just a month ago, Silver also saw a reversal to the downside and the short-term SMAX score has reached the lowest score of 0 out of 10.
Resistance levels now are found at $23.52 and at $24.96. To the downside, weak support is found around $20.07 as a potential psychological barrier. Stronger support is found at the low from July of 2013 at $18.54. With Silver showing more volatility, the trading range could be extended to the resistance level at $24.96 and the lower support level at $18.54 with the potential price objective on the lower end.
SI.F has seen over a year period now where it has had lower lows and hasn't had higher highs from the prior move. This is similar with what Gold is showing above and other Commodities giving us more reason to not try to play the bounce, but potentially look for less volatile and less risky investments.
Click on Image to Enlarge