by Wesley Gray, Turnkey Analyst
For many investors, it is an article of faith that value investing is the best approach to investing in public equities.
Value investors, who are often disciples of Ben Graham, try to buy securities at prices below intrinsic value. Indeed, the so-called “value anomaly” is among the oldest and most firmly established effects in financial markets.
But why should this effect exist?
What is it that drives investors to systematically undervalue stocks across various value categories, such as low PE ratio, low price to cash flow, or low price to book?
In the paper, “Contrarian Investment, Extrapolation, and Risk,” by Lakonishok, Shleifer, and Vishny, the authors develop a theory that when a stock has performed poorly in the past, investors expect it to continue to perform poorly in the future. That is, they unreasonably extrapolate recent history into the future and underappreciate mean reversion.
While this sounds plausible, it is still hard to understand why people might systematically do this and behave in this way.
Let’s zoom back 130 years ago…
In order to explore this issue of mean reversion, it’s helpful to go back to an experiment conducted almost 130 years ago.
Sir Francis Galton (1822-1911) was a Victorian polymath who was famous for having said, “Whenever you can, count,” a sentiment we at Turnkey Analyst can relate to.
“Whenever you can, count”
- Sir Francis Galton
We agree that counting, or measuring data, can help us understand not only what has happened in the past, but also why it happened, and what might happen in the future. Although Galton had some controversial ideas, he did have one insight that resulted in a lasting contribution to statistics that relates directly to the question of why investors underestimate the future performance of value stocks.
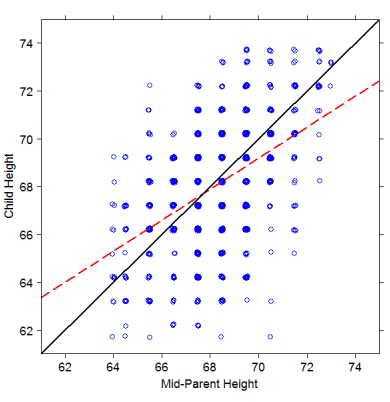
Galton’s insight relates to his studies of the inheritance of height. Galton wondered whether the average height of parents (“Mid-Parent Height”) predicted the height of their children. It seems obvious that it should, right? Galton collected height data, but when he analyzed it, he found something strange in the data. In the plot below, the solid back line represents the Mid-Parent Height of the parents Galton measured, while the dotted red line represents the heights of their children.
Although you might reasonably expect parents’ heights to accurately predict childrens’ heights, and these lines to be identical, they do not and are not. As you can see, children of tall parents tended to be shorter than their parents, while children of short parents tended to be taller than their parents. Galton described this effect as “regression towards mediocrity,” which we now know in statistics as “mean regression.”
This is a very subtle concept that is not at all intuitive, and so people tend to systematically overlook it. It is a mathematical and statistical blind spot common to humans. In the jargon of behavioral finance, humans tend to overemphasize a recent line of observations and disregard base rates, or long-term averages.
As Kahneman puts it in “Thinking Fast and Slow”:
Our mind is strongly biased towards causal explanations and does not deal well with “mere statistics.” When our attention is called to an event, associated memory will look for its cause – more precisely, activation will automatically spread to any cause that is already stored in memory. Causal explanations will be evoked when regression is detected, but they will be wrong because the truth is that regression to the mean has an explanation, but does not have a cause.
Lakonishok, Shleifer, and Vishny point out a similar idea:
To exploit this flaw of intuitive forecasts, contrarian investors should sell stocks with high past growth as well as high expected future growth and buy stocks with low past growth as well as low expected future growth. Prices of these stocks are most likely to reflect the failure of investors to impose mean reversion on growth forecasts.
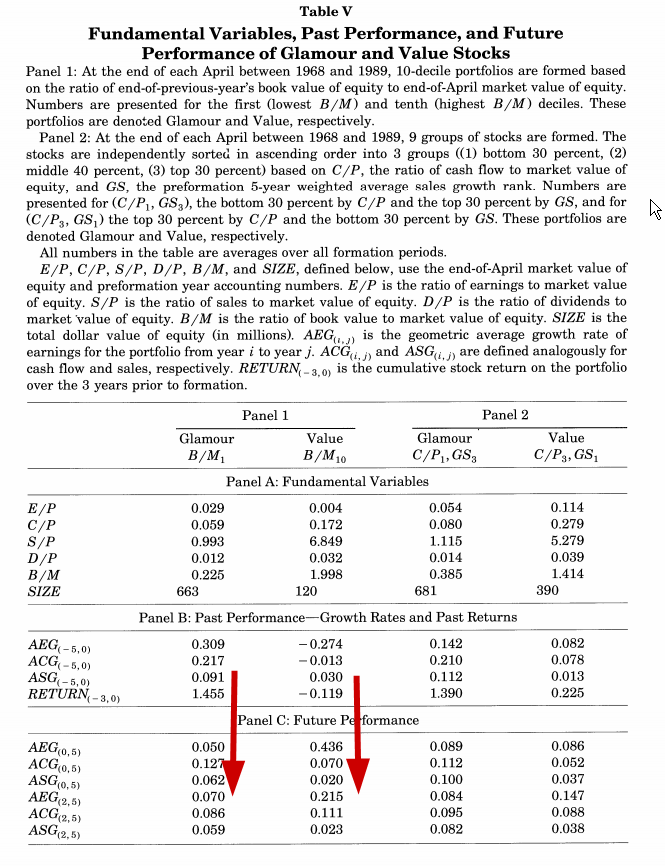
Here is some evidence of mean reversion for value and growth companies. Notice how the panel B values for growth rates of earnings, cash flows, and sales are very high for growth stocks, but very low for value stocks? Look at what happens over the next 5 years…MEAN REVERSION! Growth rates for growth stocks go down; growth rates for value stocks go up. If growth stocks are pricing a “chart to infinity,” it will end up ugly. Similarily, if value stocks are pricing a “chart to zero,” it will end up pretty.
Categories: Turnkey Behavioral Finance, Turnkey Brainwave


