Is the U.S. Entering a Strong-Dollar Phase?
September 27, 2013
by Tatjana Michel, Director, Currency Analysis, Schwab Center for Financial Research
Key Points
- The prospect of Fed tapering/tightening is likely to be good for the U.S. dollar, as the process will eventually shrink the supply of dollars. But further taper delays would probably weigh on the dollar.
- Diminishing U.S. trade and budget deficits offer moderate support for the dollar but would have to turn into surpluses for it to remain strong long term.
- Should the dollar enter a strong-dollar phase, it is not likely to soar as fast or as far as it did during the early 1980s or late 1990s.
Are we seeing the start of another strong-dollar phase? We think so—sort of. The greenback has been rising for two years, and economic and monetary trends support further gains. However, the dollar’s climb is likely to be bumpy and less pronounced than in previous dollar booms.
The recent trend is clear: Since it hit a low in July 2011, the Federal Reserve’s narrow dollar index has appreciated more than 10% against foreign currencies.1 As the Federal Reserve unwinds its ultra-loose monetary policy while other central banks hold steady, the dollar is likely to remain strong and post further gains, especially given the U.S. economy’s relative international strength, strong financial markets, improving fiscal health and narrowing trade and current-account deficits. In addition, the dollar tends to appreciate when global risk aversion rises. A rising dollar offers U.S. investors an opportunity to increase their international diversification by buying up foreign currencies at attractive prices.
Several potential stumbling blocks could keep the dollar's road ahead bumpy, including further uncertainty over the timing of tapering or tightening moves from the Fed, disappointing U.S. economic growth and corporate earnings, a renewed debt ceiling discussion, and the fiscal year 2014 budget deadline. Looking abroad, a stronger-than-expected economic recovery in Europe or in emerging markets could curb global risk aversion, increasing the relative attractiveness of those markets. They can experience counter-rallies after sharp sell-offs, especially if the recovery in the U.S. remains tepid and tapering expectations turn out to be overblown, as we have seen this September.
Relative strength of U.S. economy
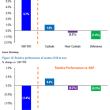
While the U.S. recovery has been moderate so far, growth prospects in most other countries are lagging, according to the graph below, showing the leading indicators from the Organization for Economic Cooperation and Development (OECD). The indicators tend to lead business cycles by six to nine months and now show U.S. growth outpacing other economies. While growth prospects in Europe and Japan are improving as well, they have turned south for emerging markets like Brazil or China. Their bonds and currencies are rebounding in September after the recent big sell-off. However, they are likely to continue suffering if U.S. rates and yields rise further.
OECD leading indicators show U.S. strength

Source: OECD as of 08/28/2013.
Note: Major Five Asia includes Indonesia, Korea, Malaysia, Philippines, and Thailand. OECD composite leading indicators (CLI) depict the deviation of economic activity from its long-term potential level (output gap fluctuations) and are used to show turning points in economies.
Monetary policy: The Fed vs. other central banks
The Fed and other central banks use monetary-policy instruments, such as interest-rate changes and quantitative easing (QE), to steer the amount of currency available. Lowering central bank rates or implementing QE by buying bonds helps widen the balance sheet, while raising rates or abandoning QE shrinks it. A smaller balance sheet means a smaller supply of currency in the market, and therefore tends to strengthen the currency as long as other central bank balance sheets shrink less or expand.
Since Fed Chairman Ben Bernanke hinted in May 2013 at plans to taper the Fed's bond purchases, U.S. rates and yields have surged as markets priced in the prospect of dollar liquidity lessening. And those rising rates make U.S. bond investments more attractive, which helps strengthen the dollar. Although the Fed will probably reduce monetary stimulus very slowly, it will likely be the first central bank to pull back on QE, giving the U.S. dollar moderate upward potential.
Central bank balance sheets

Source: Federal Reserve, European Central Bank, Bank of England, Bank of Japan as of 08/28/2013.
Note: Projections are based on forward guidance from all four major central banks. They are illustrative only and can change at any time.
Given the size of the stimulus and the moderate recovery so far, it will probably take the Fed the next two to three years to fully unwind monetary easing measures, including rate hikes. QE could wind down during 2014, with the first rate hikes possible in 2015.
In comparison, the Bank of Japan's balance sheet is projected to expand to 270 trillion yen ($2.75 trillion) by the end of 2014 while the Bank of England’s balance sheet is unlikely to shrink anytime soon. This is likely to support the dollar against the yen and the pound. The European Central Bank’s (ECB) balance sheet, on the other hand, is likely to continue shrinking as European banks keep paying back their loans and the ECB maintains ultra-low interest rates. This should keep the euro relatively strong against the dollar.
Improving U.S. fiscal health
The economic recovery has bolstered U.S. finances, shrinking the federal budget deficit as a share of gross domestic product (GDP) from 10.1% at the end of 2009 to 4.3% in June 2013, according to the U.S. Treasury. That's due in part to the U.S. housing rebound, higher tax collections, and remittances from Fannie and Freddie on the revenue side combined with cuts on the spending side. The Congressional Budget Office (CBO) forecasts the budget shortfall will decline to as little as 2.4% in 2015 before widening after 2016.
The brighter budget picture will likely be mildly supportive for the dollar for another two years—"mildly" because the budget will remain in deficit and is projected to deteriorate after 2016. It therefore won't reduce the government's debt load, according to the CBO. U.S. debt is expected to rise from 72.3% of GDP in 2012 to 76.3% in 2015, raising concerns over its sustainability, especially if U.S. yields keep rising.
Improving trade and current-account balances
The trade and current-account balances show trends in foreign trade and thus influence the value of currencies. The current account balance reflects the difference between a nation’s total exports and imports, excluding transactions in financial assets and liabilities. Generally, currencies of countries with current-account deficits are likely to depreciate over the medium- to longer-term, while currencies of countries with surpluses tend to appreciate.
A large and rising U.S. current-account deficit is usually associated with a weak dollar because it shows the U.S. spending more on foreign goods and services than it earns on its exports, thereby increasing the amount of dollars available abroad. The U.S. current-account deficit has been rising and the dollar weakening since the early 1970s. The deficit hit an all-time high of almost 6% of GDP in 2006, and the Fed’s narrow dollar index (against six other major currencies) hit an all-time low in early 2008.
U.S. dollar and U.S. current account balance

Source: Bloomberg as of 09/10/2013.
But recently, things seem to be turning. The current-account deficit fell to 2.5% in March 2013, helped by the U.S. economy’s increasing economic strength and the structural change toward slower, less export-driven and more consumption-driven growth in emerging markets. In addition, the U.S. energy boom is likely to reduce the country's import bill and, by extension, its trade and current-account deficits.
This should moderately support the U.S. dollar, especially against currencies with deteriorating trade- and current-account balances. But the U.S. current account will most likely remain in deficit due to the structure of the U.S. economy.
A strong domestic financial market
The dollar is also influenced by the relative strength and attractiveness of U.S. financial markets. The U.S. economy is likely to remain strong for some time relative to other developed countries, which are lagging, and emerging markets, most of which are facing economic slowdowns and structural challenges. That's likely to keep the U.S. markets attractive, especially if inflation remains low, as expected.
Global risk aversion
The U.S. dollar is a recognized safe-haven currency. Safe-haven currencies are those perceived as the least risky and most likely to appreciate in times of global distress. When investors get nervous about risk, they tend to flee to the safety of the United States, as it offers the most liquid and well-developed financial markets in the world.
ECB global risk aversion indicator

Source: European Central Bank as of 08/28/2013 with data up to 08/01/2013.
Note: The indicator is constructed as the first principal component of live currently available risk aversion indicators, namely Commerzbank Global Risk Perception, UBS FX Risk Index, Westpac Risk Appetite Index, BoA ML Risk Aversion Indicator, and Credit Suisse Risk Appetite Index. A rise in the index denotes an increase in global risk aversion.
The ECB’s global risk-aversion indicator has risen in 2013 but is still relatively low by historical levels. If risk aversion should rise due to an expanding Middle East conflict or emerging market crisis, it would lift the U.S. dollar and other safe-haven currencies.
Comparison to early ’80s and late ’90s
The U.S. dollar has been in a downward trend since the early 1970s when the U.S. severed the dollar’s link to gold. This has been interrupted by two major strong-dollar phases in the early 1980s and late ’90s.
Federal Reserve narrow dollar index

Source: Federal Reserve, Bloomberg as of August 27, 2013.
Note: The Fed’s Narrow Dollar Index is a weighted geometric mean of the dollar’s international value relative to a basket of six other major currencies (EUR 56.6%, JPY 13.6%, GBP 11.9%, CAD 9.1%, SEK 4.2%, and CHF 3.9%. March 1973 = 100). A value of 115 shows a dollar appreciation of 15%.
If the U.S. stays strong relative to other economies, the dollar could break the downward trend again, although we would likely see a milder and much more volatile appreciation of the dollar this time around. That's because compared to previous strong-dollar periods, U.S. growth is much weaker, the pace of inflation is significantly lower, and unemployment is higher.
Next steps
The factors we've outlined are likely to help the dollar receive moderate support during the Fed tapering/tightening cycle. Despite near-term risks, we expect U.S. stocks to remain attractive and U.S. bond yields to rise only gradually in the next six to 12 months, as much of the expected Fed tapering has already been priced in.
Before calling this a strong-dollar phase, we would like to see a clear break above the downward trend line, similar to what happened in the early 80’s and late 90’s (see chart above). Should the dollar break above that trend, it is likely to surge in the medium term. For many U.S. investors who have minimal exposure to foreign assets and currencies, this would open an attractive pricing window during which they can load up on foreign currencies and assets and increase their international diversification before the dollar returns to its longer-term trend.
In the very long term, we expect the dollar to re-embark on its slow downward journey. We expect central banks and investors to resume their pre-crisis trends of diversifying out of the dollar and into foreign currencies. Despite the possibility of further weakness in the near- to mid-term, most emerging markets have better debt and trade fundamentals than the U.S., a growing young and increasingly educated workforce, a rising share in world GDP and markets, and stronger long-term growth opportunities, which suggests longer-term appreciation potential.
The U.S. in contrast, faces long-term structural and demographic challenges likely to result in lower long-term growth rates. Therefore, it makes sense for long-term investors to maintain good international asset and currency diversification in order to spread the risk while maintaining the opportunity for higher returns.
1. Federal Reserve; Nominal Broad Dollar Index.
*****
Important Disclosures
Investors should carefully consider information contained in the prospectus, including investment objectives, risks, charges and expenses. You can request a prospectus by visiting Schwab.com or calling Schwab at 800-435-4000. Please read the prospectus carefully before investing.
Investment returns will fluctuate and are subject to market volatility, so that an investor's shares, when redeemed or sold, may be worth more or less than their original cost. Shares are bought and sold at market price, which may be higher or lower than the net asset value (NAV).
International investments involve additional risks, which include differences in financial accounting standards, currency fluctuations, political instability, foreign taxes and regulations, and the potential for illiquid markets. Investing in emerging markets may accentuate these risks.
The Schwab Global Account foreign currency capabilities allow clients to convert into multiple foreign currencies to purchase stocks in foreign markets.
Past performance is no guarantee of future results.
The information provided here is for general informational purposes only and should not be considered an individualized recommendation or personalized investment advice. The investment strategies mentioned here may not be suitable for everyone. Each investor needs to review an investment strategy for his or her own particular situation before making any investment decision.
All expressions of opinion are subject to change without notice in reaction to shifting market conditions. Data contained herein from third-party providers is obtained from what are considered reliable sources. However, accuracy, completeness or reliability cannot be guaranteed.
The Schwab Center for Financial Research is a division of Charles Schwab & Co., Inc.
Thumbs up / down votes are submitted voluntarily by readers and are not meant to suggest the future performance or suitability of any account type, product or service for any particular reader and may not be representative of the experience of other readers. When displayed, thumbs up / down vote counts represent whether people found the content helpful or not helpful and are not intended as a testimonial. Any written feedback or comments collected on this page will not be published. Charles Schwab & Co., Inc. may in its sole discretion re-set the vote count to zero, remove votes appearing to be generated by robots or scripts, or remove the modules used to collect feedback and votes.