


The so-called 60/40 portfolio is widely used as a benchmark for asset allocation when it comes to portfolio construction. But does this strategy always hold up? Daniel Morillo decided to sift through the numbers to see.
by Daniel Morillo, Blackrock, iShares
Since my last post on the merits of using equities to balance the risk of rising rates, I’ve been asked well, what is the right mix of equities and fixed income? Almost everyone’s top-of-mind answer is, of course, 60/40. It’s a portfolio that holds 60% equities and 40% bonds, and it’s widely used as a benchmark for numerous multi-asset or “balanced” allocation products. Financial professionals tend to use it as a reference point during portfolio allocation discussions with clients, and it’s widely quoted in the media.
So, does 60/40 hold up? I decided to sift through the numbers to see. What I found is that while, in general, a 60/40 portfolio may be a reasonable bet for long term investors, it might not always be the way to go for investors who hold strong convictions.
To come to this conclusion, I took equity and government bond returns from the DMS database[1], which includes annual return data for 19 countries since 1900. For each possible 10-year period in each country, I constructed the allocation that, over that particular 10-year period, would have delivered the best ratio of excess return to risk, aka the allocation with the best or “optimal” Sharpe ratio.
Figure 1 shows the average optimal bond allocation for each country, averaged across countries. Guess what? The overall average across countries and time is about 43% bonds (so, the remaining 57% would be in equities) — eerily close to the 60/40 rule.
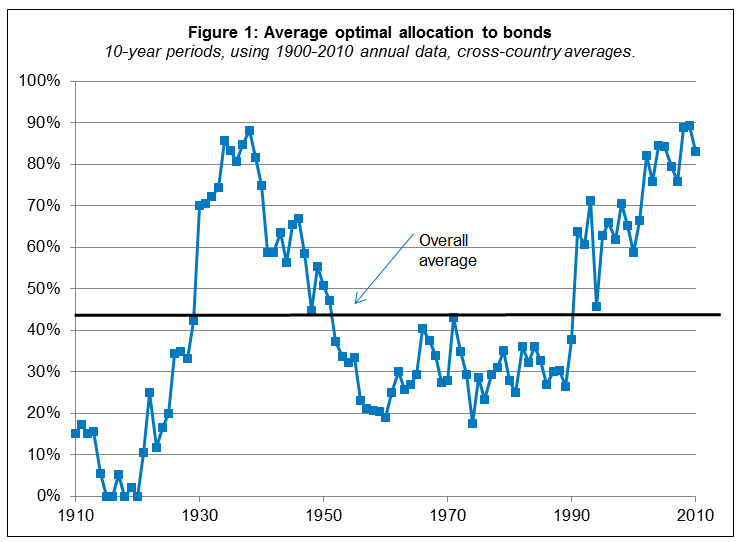
But if you look beneath the surface of the overall average, however, what you find is a significant range of optimal choices depending on the broad time period. Over the most recent 20 years or so, we see a much lower equity mix than would have been optimal during, for example, the 60s, 70s and 80s.
It is particularly interesting to note that the varied optimal allocations are primarily driven by variations in the bond component rather than the equity component. Figure 2 shows the average optimal allocation to bonds (averaged across countries so as to see the overall time pattern) alongside the average excess return to bonds over the same 10-year periods over which optimal weights are computed.
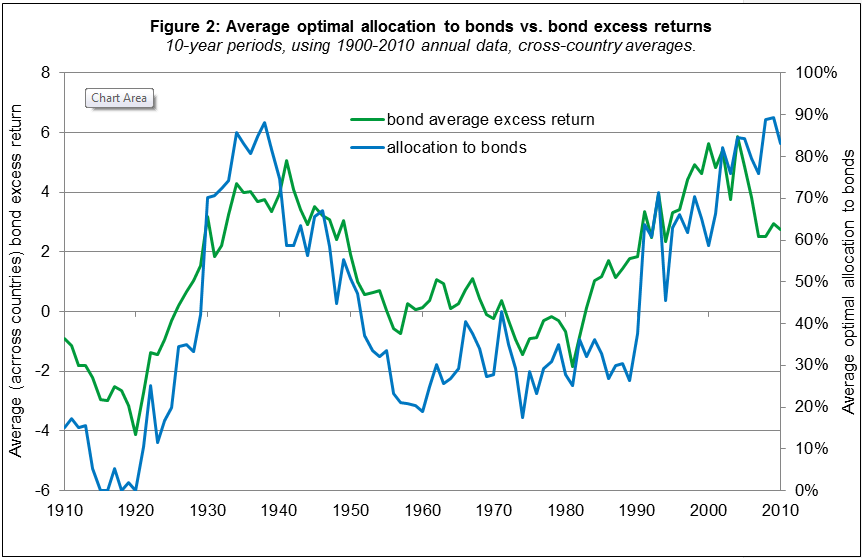
This result may seem counterintuitive given that equities are usually riskier than bonds and are indeed the key driver of the combined portfolio’s overall risk. Investors are accustomed to the expectation that they will be rewarded for the risk that a stock will not perform as imagined. In contrast, however, investors generally view bonds, especially government bonds, as “less risky” or even not risky at all.
Consider the example of the last 20 years. This period has included the so-called “bond bubble,” an era of extremely strong performance by bonds. Many market specialists have now concluded that the strong sell-off of bonds in 2013 marks the end of the bond bubble. Perhaps it has, or perhaps bonds can decline further: the key point is that investors going forward need to have a view of how bonds will perform over the next several years.
But even if the bond bubble had not occurred, investors would need to have a view about bond performance. In fact, it may surprise many investors that they actually need to have a stronger conviction about the performance of bonds than that of equities. Why this is so is reasonably simple. The optimal portfolio allocation is driven by the ratio of risk-adjusted returns of the underlying equities and bonds. On average, equity returns are higher than those of bonds. Given that, every dollar spent on bonds has a return “cost” associated with it that is traded off against the benefit of risk reduction[2]. The upshot is that moving away from 60/40 implicitly requires higher conviction about the performance of the bonds than that of equities.
In short, the analysis suggests that the 60/40 “rule” is indeed a useful starting point for investors considering a basic allocation choice between equities and government bonds, particularly for broad global portfolios where the differences in equity and bond markets across countries are less relevant. It sounds obvious to say that timing an allocation away from 60/40 requires an assumption on the likely future return of the two asset classes. However, it is perhaps less obvious that investors looking to do such timing should be much more focused on the bond component. This is because the optimal allocation will be more sensitive to changes in those views than those of the equity component.
Daniel Morillo, PhD, is the iShares Head of Investment Research and a regular contributor to The Blog. You can find more of his posts here.
[1] The DMS data is collected by Dimson, Marsh and Staunton as described in “101 years of global investment returns” (2002) and updated annually. For bond returns I use nominal long-term government bond (i.e. “treasuries”) total return for each country in excess of the nominal short-term bond return (i.e. the “risk-free” or “bill” rate) for that country. For equity returns we use nominal equity total returns in excess of the nominal short-term bill return. [2] Given two assets with positive expected returns and , a correlation of and a ratio of volatilities of the optimal allocation to asset 1 is given by:
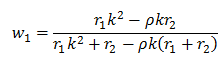
To assess sensitivity of the allocation to changes in returns, we can compute the ratio of derivative of the optimal weight to each of the two asset returns:
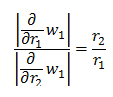
This means that the allocation will be more sensitive to changes in the return of whichever asset has the smaller return.
Copyright © Blackrock, iShares