by Mohamed El-Erian, originally posted at PIMCO,
To say that bonds are under pressure would be an understatement. Over the last few months, sentiment about fixed income has flipped dramatically: from a favored investment destination that is deemed to benefit from exceptional support from central banks, to an asset class experiencing large outflows, negative returns and reduced standing as an anchor of a well-diversified asset allocation. Understanding well what created this change is critical to how investors may think about the future, including the role of fixed income as part of prudent investment portfolios that help generate returns and mitigate risk.
Tailwinds to headwinds
To illustrate the rapid changes in perceptions, consider where fixed income stood just a few months ago (at the end of April to be exact).
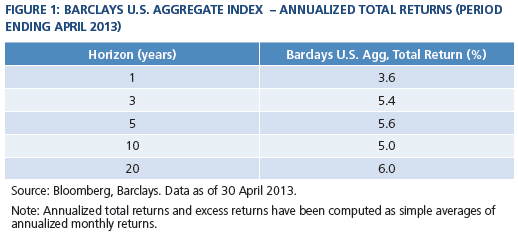
A diversified portfolio of high quality bonds, as defined by the widely followed Barclays U.S. Aggregate benchmark, had delivered strong returns over the last 20 years (Figure 1). The 1-,
3- and 5-year annualized returns stood at 3.6%, 5.4% and 5.6% respectively. For the 10-year period, it had generated an annualized return of 5.0%.
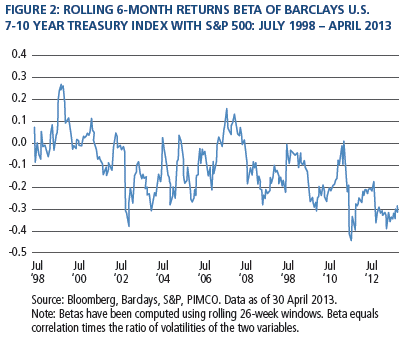
In addition to delivering solid returns with lower volatility relative to stocks, the inclusion of fixed income in diversified asset allocations had also helped to reduce overall portfolio risk, including through generally negative correlations of returns of Barclays U.S. Aggregate and U.S. Treasury indexes with S&P 500. Diversification was particularly beneficial in the last 15 years (Figure 2).
The combination of return generation and risk diversification was part of a broader virtuous circle for fixed income, which also included significant inflows to the asset class and direct support from central banks.
As an example, between Q1 1998 and Q1 2013, fixed income assets held by households and pension funds increased from $4.7 trillion to $12.1 trillion. Accordingly, their share in the market value of financial securities of U.S. households and pension funds rose to some 35%.
The asset class was also helped by exceptional policy support from the Federal Reserve Bank. This served to both bolster returns and suppress volatility.
Deploying a highly unconventional and experimental set of policy tools, the Fed resorted to repressed interest rates as their main transmission channel to meet their economic objectives, including higher employment. Specifically, in an attempt to use the portfolio channel to trigger a beneficial combination of the wealth effect and animal spirits, central bankers supplemented their traditional policy lever (namely, a federal funds rate floored near zero) with two more unconventional policy tools: aggressive policy statements (or “forward guidance”) and large-scale market purchases of U.S Treasuries and mortgage-backed securities (“quantitative easing” or QE). As a result, and despite a multi-decade journey during which the yield on the 10-year bond declined from 16% at the end of September 1981 to below 2% at the end of April 2013, investors in fixed income were comforted by the notion that they enjoyed a “Fed put” at overvalued levels – which encouraged the justification of artificially high prices.
All of this changed markedly starting in April 2013. Since then, the Barclays U.S. Aggregate has delivered a negative return of 4.5% (May through 6 September 2013) and bond funds have experienced sharp outflows.
The impact of higher interest rates overwhelmed the diversifying characteristics of virtually all other fixed income securities.
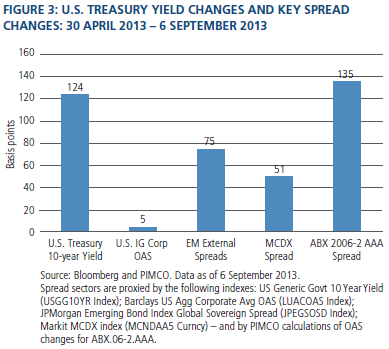
In many prior episodes of rising U.S. Treasury yields (and especially those associated with materially improving economic fundamentals), credit-sensitive sectors of fixed income were supported by the tightening of credit risk spreads. In the most recent sell-off, however, even spread sectors came under pressure. Displaying higher correlation with Treasuries, credit spreads widened, thus selling off more than Treasury securities (see Figure 3, which includes market proxies for U.S. Treasuries, investment grade corporates, emerging markets sovereigns, municipals and non-agency mortgages).
Policy, fundamentals, flows and technicals
U.S. Treasuries have historically come under pressure due to two developments that are normally related; indeed, they have often occurred simultaneously: a recovery in nominal growth and a consequent tightening of monetary policy. And, over the last few weeks, there have been growing expectations of both.
Several data releases point to a U.S. economy that continues to heal, albeit at a gradual pace – thus lifting hopes that the U.S. will finally be able to break out of the “New Normal” real growth rate of around 2%. Ongoing innovation, particularly in energy and technology, has amplified these hopes.
At the same time, starting on 22 May 2013, Fed officials began sending signals of their intention to taper their experimental support for markets and the economy. While the signals referred only to one (QE) of the three measures in place, and while the intention is to lessen the expansionary impulse rather than pivot to a contractionary one, markets have behaved as if all three were now in doubt. Simply put, the Fed is now seen as less able and/or less willing to continue with its current degree of policy accommodation.
The ensuing reaction of markets has been quite extreme. The sharp move in interest rates has been accompanied by an increase in volatility, pockets of liquidity dislocations, and unstable and changing correlations. In addition, short-end rates have been pressured higher even though this is the part of the yield curve that the Fed influences most by its current rate stance and its forward guidance.
Yet our analyses suggest that all of this reflects much more than market perceptions of an improving economy and a change in policy. Specifically, these movements have also been driven by notable shifts in financial asset preferences and related flows, along with some rather nasty market technicals.
Consider the following factors as partial illustrations:
- After a first quarter of record inflows, approximately $106 billion has exited global fixed income mutual funds in 2013, with U.S. retail funds particularly hard hit.
- Risk parity investors have delevered quite forcefully due to an increase in rates and volatility, spiking correlations and aggressive drawdown control rules. Based on data from publicly traded mutual funds, we estimate that managers of risk parity portfolios sold over $60 billion of 10-Year equivalent in TIPS (Treasury Inflation-Protected Securities), nominal Treasuries and other interest-rate-sensitive securities.
- Hedge funds have cut back on carry trades, particularly front-end exposures, despite the Fed’s guidance that it will maintain near-zero interest rates for an extended period of time.
- REITs (real estate investment trusts) and other mortgage-related investors have been sellers of interest-rate-sensitive securities as yields rose and mortgages extended in duration (consistent with the decline in refinancing at higher rates).
- CFTC (Commodity Futures Trading Commission) data show that the collective net short position held in 5-year Treasury futures is now the largest in the last 3 years and among the largest in the last 5 years.
- TIC (Treasury International Capital) data point to a decline in foreign purchases of U.S. Treasuries.
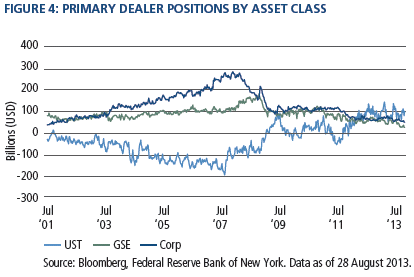
- Broker-dealers have little appetite for inventory, thereby reducing the ability of markets to facilitate normal risk transfer (Figure 4).
Add to all this the selling by central banks (reserve managers) in emerging economies and a slow shift to lower duration benchmarks, and the result resembles for now a “technically damaged” asset class. In addition, with the recent decline in investor concerns about Syria, Europe and China, the attraction of Treasuries as a flight to quality has receded in the most recent weeks.
In historical episodes broadly similar to these, interest rate markets can overshoot and contaminate neighboring asset classes. These also tend to be periods where markets get quite myopic. Indeed, just witness the almost total absence of attention being paid by analysts to the improving net supply dynamics due to declining U.S. Treasury issuance and the sharp fall in mortgage production.
The liquidity-challenged segments of fixed income are particularly impacted by the technical disruption in the “risk-free” Treasury anchor.
As an example, consider what has happened to emerging markets investments, be they in sovereign bonds, local bonds or foreign exchange. The across-the-board sell-off has been accentuated by the extent to which the crossover investor base (“tourist dollars”) has overwhelmed the dedicated investor base. As a result, there are already some compelling opportunities at the front end of strong sovereign credit curves.
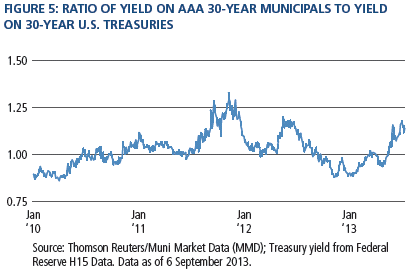
Technical dislocations are also evident in municipal bonds, where the impact of the rates sell-off has been accentuated by credit concerns derived from developments in Detroit and Puerto Rico. Here, the federally tax-free AAA segment of the market is trading at a yield ratio of 1.16x comparable maturity Treasury yields (Figure 5). This ratio was 1.0x at the end of April 2013 and a tighter 0.9x earlier in the year. The yield movement on AA federally tax-exempt municipals has been equally notable – the ratio of yields has jumped from 1.07x for 30-year Treasury yields as of end-April 2013 to 1.24x currently.
What to do?
In reacting to the recent sell-off in fixed income, investors first need to be quite explicit about three (related) macro issues in particular:
- The likely scale and scope of the U.S. recovery, as a standalone and relative to what else is happening in the global economy;
- The Fed’s motivation for tapering; and
- At what stage are nasty technicals likely to exhaust themselves, as lower bond prices discourage additional selling and also entice new buyers (be they liability managers, fundamental flows or fast money positioning).
As much as we wish for otherwise (particularly in view of the most positive high-frequency data), there is still not enough evidence to conclude that the U.S. economy will be able to emerge decisively and durably from its low growth equilibrium in the next few quarters. The impact of sluggish domestic components of aggregate demand is compounded by declining growth in emerging economies, insufficient structural reforms and public infrastructure investments, and stubborn residual pockets of excessive leverage – all of which limit the expansion propensity of corporate America, the one component of the private sector with the wallet (but not the will as yet) to spend.
Congressional political polarization is not helping the outlook for a high and durable fundamental U.S. recovery. At a time when the economy needs a tailwind from Capitol Hill, lawmakers risk creating renewed headwinds when they finally turn their attention to steps to keep the government running and lift the debt ceiling.1 As for the Fed, we should all hope for “good” reasons for it to taper – meaning that the central bank has strong reasons to believe that the U.S. economy is approaching “escape velocity.” But the Fed could also taper for “bad” reasons – that is to say that its prolonged experimentation with unconventional monetary policy threatens to create too much collateral damage and unintended consequences (including concerns about misallocation of resources, excessive risk-taking and damage to the functioning of certain markets).
In all likelihood, the Fed will taper for a mix of reasons. Specifically, it will likely be comforted by the notion that the American economy continues to heal, but also frustrated by the gradualism of the recovery and the threat of collateral damage. Meanwhile, look for the Fed to try to compensate the potential contractionary impact of tapering by evolving its forward guidance policy.
The most difficult call relates to technicals. Given their behavioral finance dimension, they have a bad (though understandable) habit of surprising even the most experienced and astute investors. And as much as they may be discounted by some long-term investors, bad technicals can contaminate fundamentals due to their path-dependency dynamic (that is to say, rather than immediate mean reversion, the tendency of one disruptive move increasing the probability of additional ones).
These different considerations reinforce the investment conclusions set out by Bill Gross in his Investment Outlook of last week.2 Specifically, fixed income investors should respect the technicals for now, emphasize the front end of curves on the basis of the policy pivot (from QE to forward guidance), and consider TIPS as a source of endogenous portfolio hedging. They should look to exploit large technical dislocations that are anchored by upcoming maturities and other self-liquidating characteristics. And, given that the bad technicals will run their course eventually, they should prepare to take advantage of broader overshoots that provide both attractive valuations and solid carry.
The greater the movements in fixed income fueled by changes in the Fed’s policy paradigm and investor asset preferences, the more the investor community needs to pay attention to an asset class that inevitably impacts the attractiveness of other asset classes, covariances and the robustness of overall asset allocations. And investors should guard in particular against the potentially disruptive element of fixed income technical overshoots – meaning interest rate spikes that cannot be validated by an economic recovery, policy rate increases or sustainable asset shifts.
Concluding remark
Similar to prior periods, history will regard the ongoing phase of dislocations in the bond market as a transitional period of adjustment triggered by changing expectations about policy, the economy and asset preferences – all of which have been significantly turbocharged by a set of temporary and ultimately reversible technical factors. By contrast, history is unlikely to record a change in the important role that fixed income plays over time in prudent asset allocations and diversified investment portfolios – in generating returns, reducing volatility and lowering the risk of severe capital loss.


