In this week's SIA Equity Leaders Weekly we are going to revisit the US Dollar Continuous Contract, which we last looked at a little over a month ago, and also Silver, which we have not focused on since April of this year, to see how things have changed.
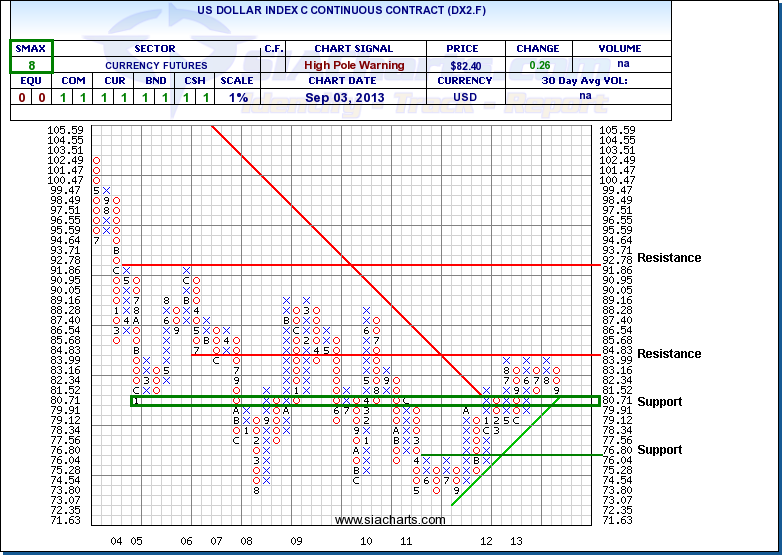
U.S. Dollar Index Continuous Contract (DX2.F)
When we last looked at the DX2.F, the U.S. Dollar Index was banging up against resistance at 84.83 which we can see has now held for the third time in the last year. The Index has now reversed downwards and is sitting on the first level of support in the 80-81 range, along with the rising trend line. Should this support break there is room for further potential movement down to the 76 area.
As we have been discussing previously, the rise of DX2.F was putting pressure on Commodities, and with this short term weakening we have also seen a recovery in Commodities over the near term.
Click on Image to Enlarge
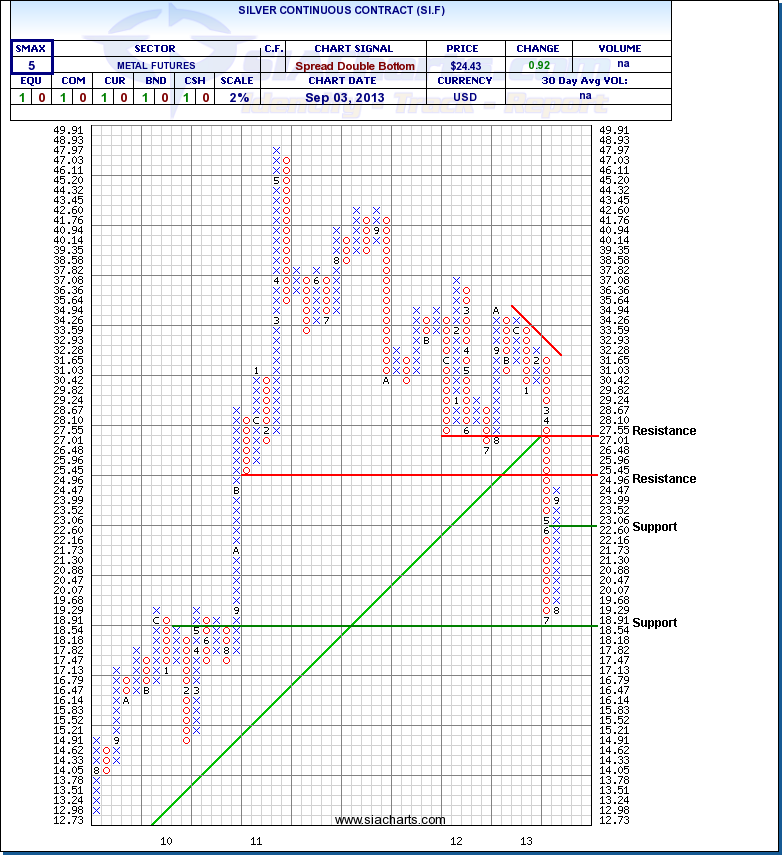
Silver Continuous Contract (SI.F)
Since we last looked at Silver back in April where we were discussing the weakness that Silver was showing at the time, Silver subsequently broke down to levels last seen in 2010, but has subsequently bounced back up over the last month and is now closing in on the resistance at $25.45. Should this strength continue then the next potential resistance level is at $27.55.
This bounce seems to have corresponded with the pullback in the U.S. Dollar Index, so should the strength return in the Index then we should be watching for the support levels at $22.60 and again at the low from the last drop at $18.54.
As we can see from the charts today, we continue to monitor these relationships closely as further weakness or strength in the DX2.F could either help to continue the run up in Commodities we have seen recently, or end it.
Click on Image to Enlarge
SIACharts.com specifically represents that it does not give investment advice or advocate the purchase or sale of any security or investment. None of the information contained in this website or document constitutes an offer to sell or the solicitation of an offer to buy any security or other investment or an offer to provide investment services of any kind. Neither SIACharts.com (FundCharts Inc.) nor its third party content providers shall be liable for any errors, inaccuracies or delays in content, or for any actions taken in reliance thereon.
Copyright © SIACharts.com