


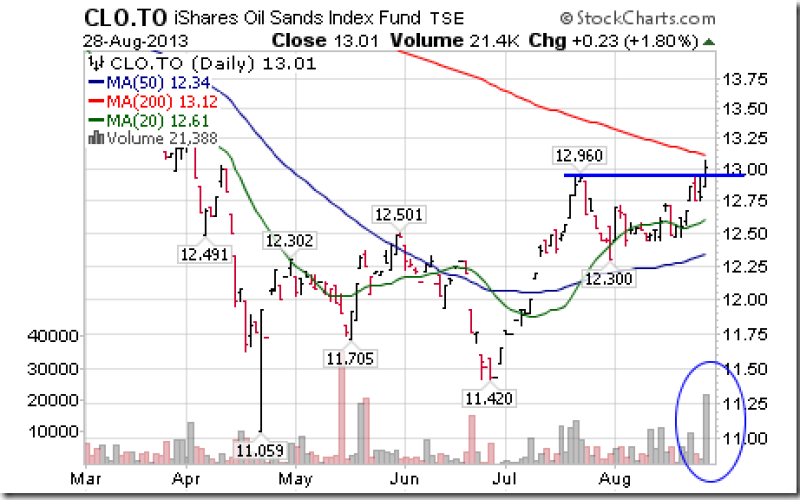
Gasoline prices are spiking following the move by crude oil to a 30 month high.


Oil sands stocks and their related ETF are responding to higher crude oil prices.

Higher natural gas prices also are contributing to strength in the energy sector on both sides of the border.

Weekly Technical Review of Select Sector SPDRs
Technology
· Trend changed from up to neutral on a move below $31.37 (Score: 0.5)
· Units remained below their 20 day moving average and fell below their 50 day MA (0.0)
· Strength relative to the S&P 500 Index remains positive (1.0)
· Technical score based on the above indicators slipped to 1.5 from 2.0 out of 3.0
· Short term momentum indicators are trending down.

Materials
· Trend remains positive
· Units remain below their 20 day moving average
· Strength relative to the S&P 500 Index remains positive
· Technical score remains at 2.0 out of 3.0.
· Short term momentum indicators are neutral.

Consumer Discretionary
· Trend remains neutral
· Units remain below their 20 and 50 day moving averages
· Strength relative to the S&P 500 Index remains neutral.
· Technical score remains at 1.0 out of 3.0
· Short term momentum indicators are oversold.

Industrials
· Trend remains neutral
· Units remain below their 20 day moving average and fell below its 50 day MA
· Strength relative to the S&P 500 Index changed from positive to neutral
· Technical score slipped to 1.0 from 1.5 out of 3.0
· Short term momentum indicators are oversold.

Financials
· Trend remains down
· Units remain below their 20 and 50 day moving averages
· Strength relative to the S&P 500 Index remains negative
· Technical score remains at 0.0 out of 3.0
· Short term momentum indicators are oversold.

Energy
· Trend remains down.
· Units moved above their 20 and 50 day moving averages
· Strength relative to the S&P 500 Index changed from negative to positive.
· Technical score improved to 2.0 from 0.0 out of 3.0
· Short term momentum indicators are recovering from oversold levels.

Consumer Staples
· Trend remains down
· Units trade below their 20 and 50 day moving averages
· Strength relative to the S&P 500 Index remains negative
· Technical score remains at 0.0 out of 3.0
· Short term momentum indicators are oversold

Health Care
· Trend remains up
· Units remain below their 20 and 50 day moving averages
· Strength relative to the S&P 500 Index remains neutral
· Technical score remains at 1.5 out of 3.0
· Short term momentum indicators are oversold.

Utilities
· Trend remains neutral
· Units remain below their 20 and 50 day moving averages
· Strength relative to the S&P 500 Index improved from negative to neutral
· Technical score improved to 1.0 from 0.5 out of 3.0.
· Short term momentum indicators are trying to recover from oversold levels.

Special Free Services available through www.equityclock.com
Equityclock.com is offering free access to a data base showing seasonal studies on individual stocks and sectors. The data base holds seasonality studies on over 1000 big and moderate cap securities and indices. Notice that most of the seasonality charts have been updated recently.
To login, simply go to http://www.equityclock.com/charts/
Following is an example:
ENERGY Relative to the S&P 500 |
Disclaimer: Comments and opinions offered in this report at www.timingthemarket.ca are for information only. They should not be considered as advice to purchase or to sell mentioned securities. Data offered in this report is believed to be accurate, but is not guaranteed.
Don and Jon Vialoux are research analysts for Horizons Investment Management Inc. All of the views expressed herein are the personal views of the authors and are not necessarily the views of Horizons Investment Management Inc., although any of the recommendations found herein may be reflected in positions or transactions in the various client portfolios managed by Horizons Investment Management Inc
Horizons Seasonal Rotation ETF HAC August 28th 2013


