For this week's SIA Equity Leaders Weekly, we are going to take a technical outlook at some of the main U.S. indices, the S&P 500 Composite Index and the Nasdaq Composite Index, as they have both moved to new all-time highs this August and continue to be a major focus moving forward.
S&P 500 Composite Index (SPX.I)
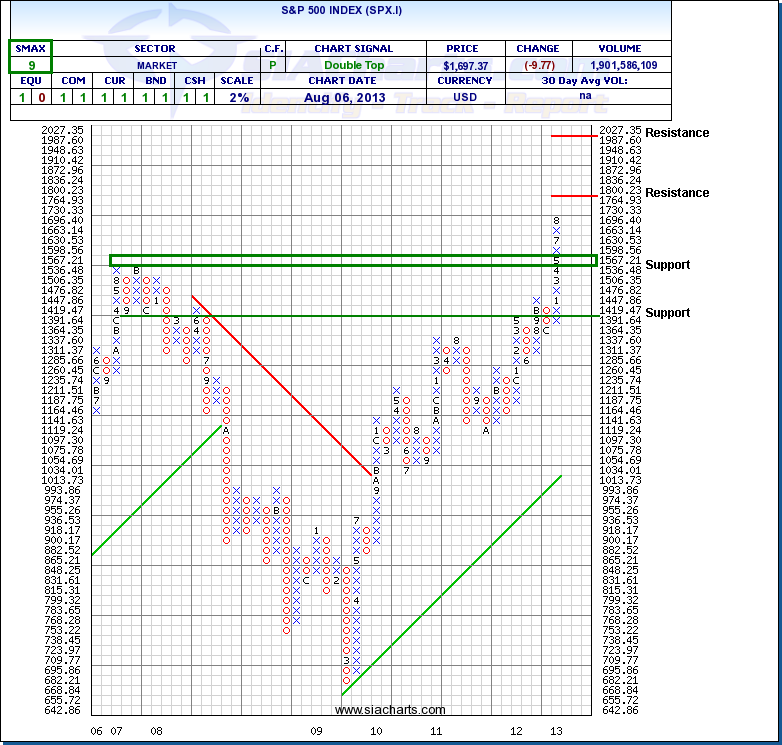
Our last outlook on the SPX.I highlighted the prior resistance level at 1696.40 that could provide some temporary resistance in the short term. But having moved up through this resistance level to new all-time highs, the S&P 500 Composite Index's next target resistance level is now at the 1800 level. A move above this could give it some room to move towards psychological resistance in the 2000 area.
Support to the downside is now found above the mid 1500's area if the strength reverses. With a near-term SMAX score of 9 out of 10, the S&P 500 Composite is still showing strength against all other asset classes. Even with all the volatility in the market, the chart has not seen any reversals so far in 2013 on a 2% scale.
Click on Image to Enlarge
Nasdaq Composite Index (NASD.I)
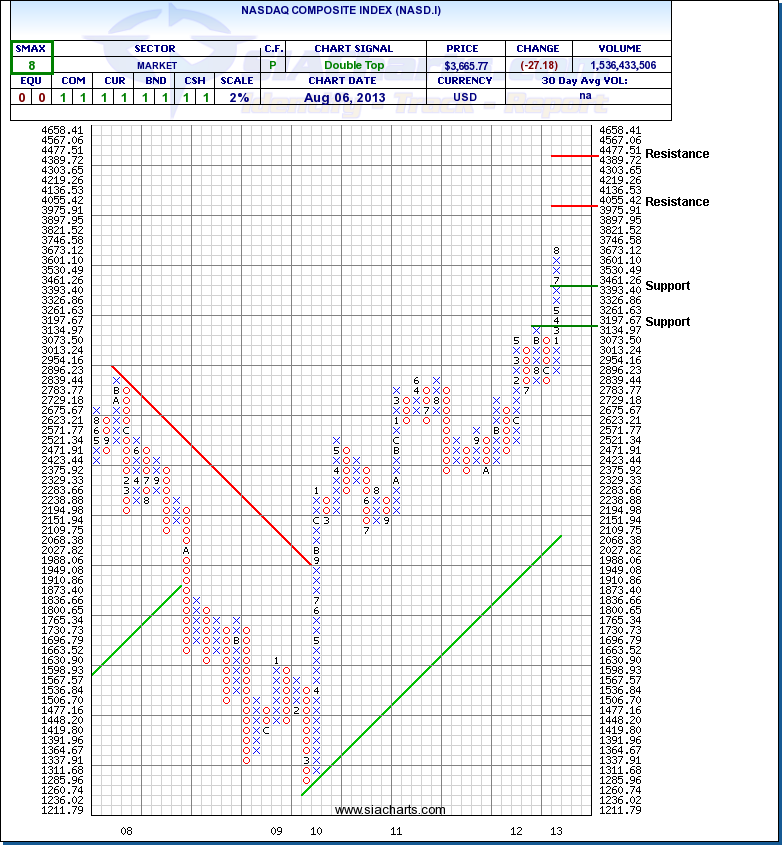
Taking a look at one of the other major U.S. indices, the Nasdaq Composite has moved up another ~14% since we last highlighted it in March. Resistance is now found above at the 4055.42 level and also at 4477.51 should this strength continue.
As you can see on the chart to the right, the NASD.I has also not seen any reversals so far in 2013 on a 2% scale. Support is now found at 3393.4 and below this at 3134.97 if a reversal does take place. Key holdings at the top of the Favored zones like high alpha stocks Tesla (TSLA) and Netflix (NFLX), which are both up ~223% since entering the Favored zone of our SIA reports, have helped our advisors find major outperformance while avoiding some of the big names like Apple (AAPL), Intel (INTC), and Microsoft (MSFT) which have all underperformed the benchmark this year.
Click on Image to Enlarge


