by William Smead, Smead Capital Management
A great deal of time and energy is spent trying to determine when the current bull market in stocks will end. We at Smead Capital Management make no effort to time the stock market because after 33 years in the investment business I’ve never found anyone who did it successfully. We do try to avoid capital misallocation and thought you might want to look at the history of the investment asset classes to see how periods of popularity lead to misery and periods of misery lead to above-average returns.
What triggered these thoughts was an article in Barron’s dated August 3rd, 2013 titled “The New IPO Boom”. The writer, Jack Willoughby, explained that the market for Initial Public Offerings (IPOs) of common stock have heated up this year and could be heating up more. Here is how Willoughby describes the circumstances:
This is a golden era for initial public offerings. More of them priced in the second quarter of 2013, 44 in all, than in any period since the final quarter of 2006. A strong small-cap market has helped push these fledgling-company shares to new heights: The average first-half deal jumped 16.97% on its first day, gaining a total of 39.16% by the end of July. “I’d characterize the IPO market as white hot,” says Tim Keating, CEO of the Denver area’s Keating Capital, which invests in private offerings of companies on track to become public.
Willoughby went on to point out that a number of future potential IPO stars sit on the sidelines like Twitter and Spotify. In his view, things could get pretty frothy. It’s been my observation that silly trading in untested IPOs has been a good predictor of stock market corrections. Large multi-year issuance of new companies and large use of the secondary market for common stocks increases the total outstanding supply of common stock and can have a big effect on prices at the margin. Should the long-duration common stock owner be concerned about the market heating up for IPOs? Secondly, should the owner of large-cap stocks adjust what they are doing when the IPO market becomes an over-heated thermometer?
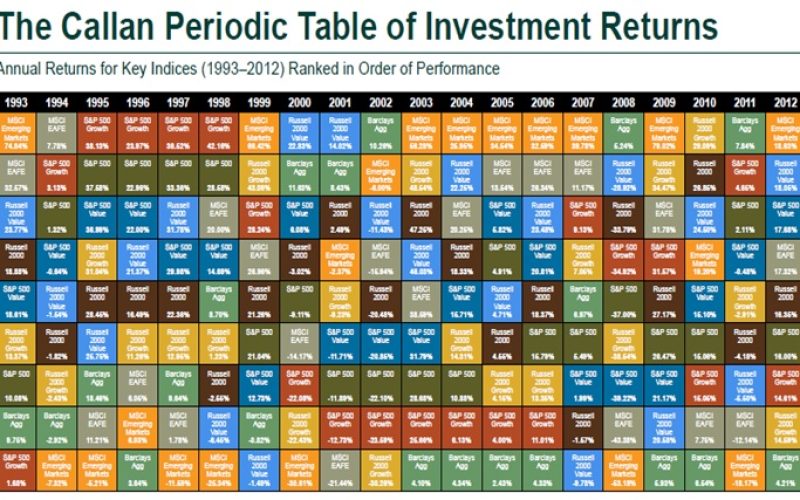
Our first look at this comes from Callan’s long-term style box chart. The purpose in looking here is to get a feel for the over-capitalization of asset classes:

Source: Callan Associates Inc.
Three to five years of first and second place finishes is a warning sign for asset classes. Four years near the bottom of the chart indicates pretty good fishing for the discerning long-term asset allocator. There appears very little to worry about in the US small-cap realm from any overt popularity. For example, US large was on fire from 1996-2000 and heading for the deep, long-term doghouse. More recently, MSCI Emerging Markets have had an unusually long streak of first place finishes and appear to be an area which should be avoided at all costs. Nothing we see on this chart indicates the kind of popularity which would make five years of purgatory likely for small cap US stocks.
With the chart as a backdrop, we’ll take a stroll down IPO memory lane. Small caps were mega-popular by 1983 in the aftermath of IPOs like Apple (AAPL) and Genentech (GENE) in 1980. The US small cap equity market peaked on June 24th, 1983 at 126.99 as measured by the Russell 2000 index. By the Oct. 19th, 1987 low in the US stock market, the Russell 2000 bottomed was at 133.71. The year 1983 was a good time to back off on small caps, but was a poor time to reduce ownership of large cap stocks. From June 24th, 1983 to October 19th, 1987, the Dow gained 8.1% per year versus a gain of 1.18% in the Russell 2000.
Small caps got popular in 1996 with Netscape’s IPO in 1995 leading the way to another “white hot” IPO market. This era is marked by Federal Reserve Board Chairman Alan Greenspan calling the frothiness in stocks “irrational exuberance” in December of 1996. The great irony of 1996 was that the froth got handed off like a relay race at a track meet from small caps to large caps. This handoff came from the massive upward movement in capitalization of all the tech, telecom, and internet stocks. I remember the extremities which existed back then. A company called Etoys went public in 1999 and immediately grew to a $10 billion market cap with less than $100 million of sales, while bleeding red ink all over their quarterly earnings reports. Toys-R-Us had $10 billion in sales and a $300 million after-tax profit and had a market cap of $3 billion.
From a historical standpoint, the last thirteen years are one of the longest stretches of US small-cap outperformance relative to US large-cap from an asset class perspective. It was set up by the hot streak large-cap had from 1996-2000 and the ridiculous P/E ratios which ensued. The S&P 500 index peaked at around 31 P/E and small-cap value stocks traded in 1999 at a low of 13 P/E based on trailing earnings (Russell 2000 Value index). Watch the IPO market in the coming months for clues when that relative performance might start hitting the wall. Here is how Willoughby clued us in through his Barron’s article:
But can the small-cap market handle the stampede? The multiple on the Russell 2000 is a hefty 19 times next year’s projected earnings, well above the large-cap benchmark S&P 500′s 14 times.
With each passing quarter, it becomes more likely that the two-year small-cap rally will slow down or even reverse course, says Henry Ellenbogen, portfolio manager of the T. Rowe Price New Horizons fund (PRNHX), with assets of $12 billion.
The current circumstance feels like 1983 and 1996 to us and could bode well for the long-duration common stock investor. Thanks to another article in the USA Today on August 4th, 2013 titled, “IPOs are back on the Street”, here is a chart of IPOs from 2003 to today:

We believe a cursory glance would indicate that it will take more than this year’s strength in the IPO market to kill the bull market in US small –cap equities. It has been our observation that small caps usually don’t peak until the IPOs quit jumping to an immediate premium and the supply of shares outstanding gets overwhelmed by more mature companies diluting their existing ownership via secondary common stock offerings. As we see it, today’s massive stock buybacks and the buying which comes from under-represented institutional and high-net worth individual investors should provide a great deal of support to US large cap equity ownership. It will take massive dilution to interrupt the process, in our opinion, and nothing appears to show that we aren’t in the early innings of solving the under-representation problem.
Best Wishes
William Smead
The information contained in this missive represents SCM’s opinions, and should not be construed as personalized or individualized investment advice. Past performance is no guarantee of future results. It should not be assumed that investing in any securities mentioned above will or will not be profitable. A list of all recommendations made by Smead Capital Management within the past twelve month period is available upon request.
This Missive and others are available at smeadcap.com


