For this week's SIA Equity Leaders Weekly, we are going to update some commentary we made about a couple of stock sectors back in March of this year and we are also going to look at 2 sector comparisons: one from the stock sectors analysis and the second one from our mutual fund sectors analysis.
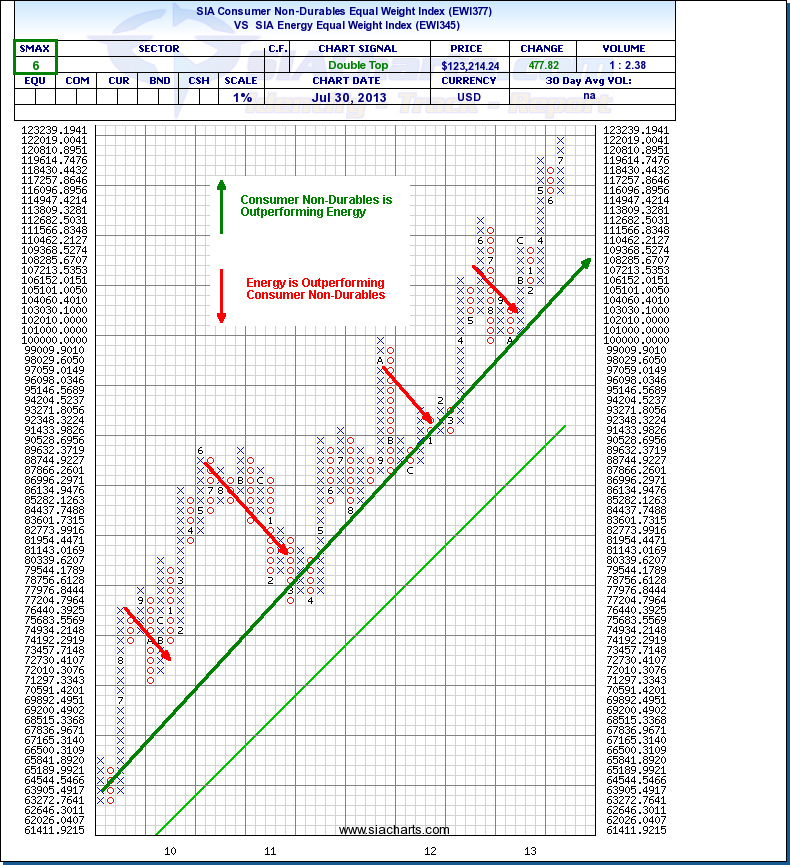
SIA Consumer Non-Durables Equal Weight Index vs. SIA Energy Equal Weight Index (EWI377^EWI345)
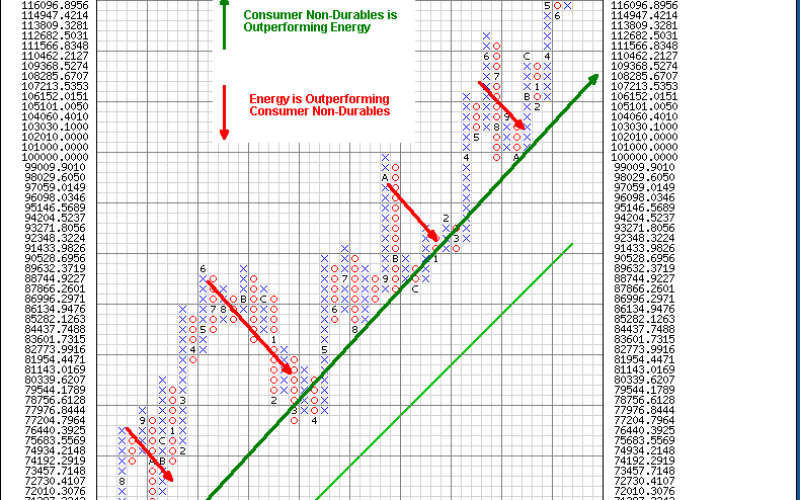
Looking at the chart to the right, we can see a comparison between our current top ranked stock sector, "Consumer Non-Durables," against one of the lower ranked sectors in "Energy." Back in March, we commented on the weakness that both Energy and Metals and Mining were showing as sectors. As always, we were advising to stay away from this weakness and instead find stronger sectors to invest in. As many advisors may carry a lot of common holdings from these sectors in their client portfolios, this can be an important analysis to overlay your stock selection with.
Looking at the chart, we can see that other than for short periods of time where Energy exerted its strength, Consumer Non-Durables has been winning this battle for years now. If we use that March date from 2013 as a starting point that we did the recent commentary on, since that time Metals and Mining is down 17.8%, Energy is up 3.4%, and the top sector has moved up 14.8%. It is also interesting to note that Consumer Non-Durables has been the top sector for over 22 months now, and has been in the favored zone of the SIA Stock Sectors Report for over 4 years.
Click on Image to Enlarge
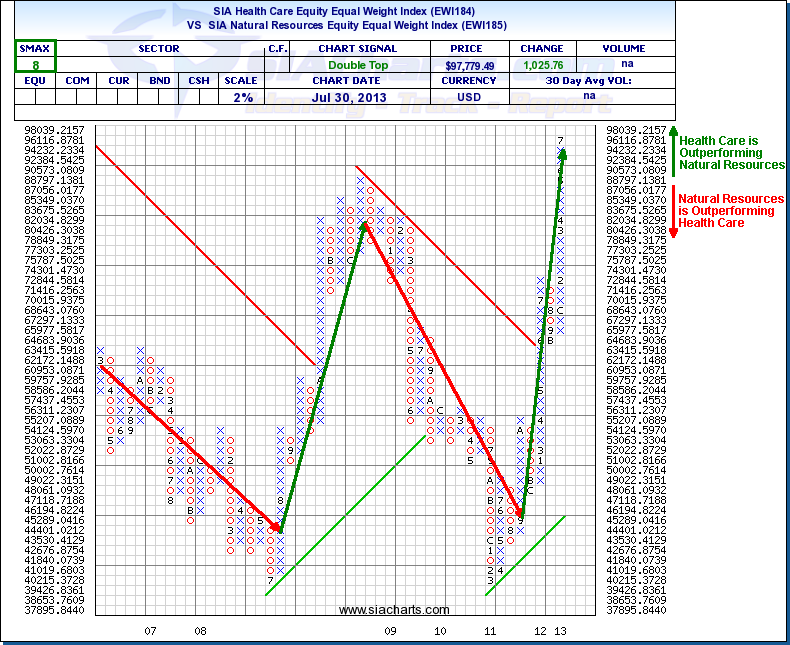
SIA Health Care Equity Equal Weight Index vs. SIA Natural Resources Equity Equal Weight Index (EWI184^EWI185)
Moving over to our Mutual Funds Sectors tab, we are going to test and see if the relative strength comparisons that we have just used with stocks can also hold true for Mutual Funds as well.
The Health Care Equity sector has been up at the top of the rankings for over a year now, and in this case, we are going to use the Natural Resources sector to compare against, as this contains mutual funds inside this sector that are Energy based. Looking at the comparison chart, we can see that going back to 2006 there have been multi-year periods where either sector has been stronger, but since the final quarter of 2011, the current relative strength has been favoring Health Care.
Since that same March date that we used for the above comparison, Health Care has moved up 11.7% and Natural Resources is down 8%. For those interested, the TSX Composite Index (TSX.I) is down over 1% over this time frame, showing nice continued outperformance by the top Mutual Fund Health Care sector.
In summary, whether we are looking at stocks, mutual funds, or ETFs, we continue to focus our attention towards buying and staying in strength and avoiding relative weakness. By focusing in on the different sectors or industries that have the highest peer relative strength, SIA can help reduce risk and potenitial underperformance.
Click on Image to Enlarge


