by The Short Side of Long
Weekend Sentiment Summary (July Week 4)
Equities
- Sorry for a bit of a late update (usually posted on the weekend), but lets get straight into it...
- AAII survey readings came in at 45% bulls and 23% bears. Bullish readings fell by 3% while bearish readings rose by 1%. The AAII bull ratio (4 week average) currently stands at 68%, which indicates very high optimism amongst the retail investment community. According to my own data, this is usually a "sell signal" zone for this indicator. For referencing, AAII bull ratio survey chart can been seen by clicking here, while AAII Cash Allocation survey chart can be seen by clicking clicking here.
Chart 1: Newsletter advisors remain very confident on US equities!
Source: Short Side of Long
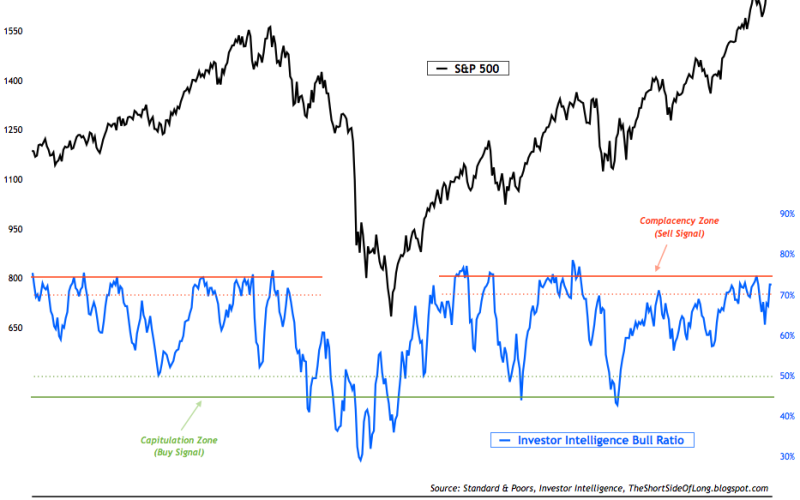
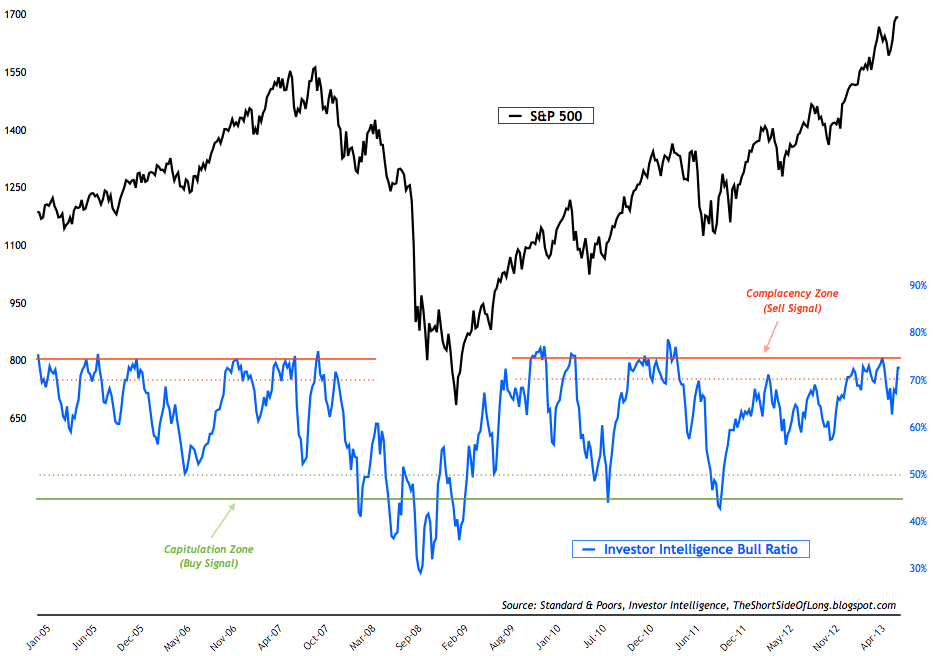
- Investor Intelligence survey levels came in at 52% bulls and 20% bears. Both the bullish and the bearish readings remains very similar from last weeks levels. II bull ratio currently stands at 72.5% and is once again at the "sell signal" territory (chart above). A large cluster of "sell signals" in the row usually an intermediate or a major top, just like in middle of 2007 or early 2011.
- NAAIM survey levels came in at 88% net long exposure, while the intensity rose dramatically towards 215%. Usually, it is rare of intensity to rise above 200%, because long emphasis managers go as far as 200% exposure while short emphasis managers usually just reduce their exposure to 0% (or no shorts). The current survey showed that even the super bearish managers are bullish on the market and holding a 15% net long exposure. For referencing, recent NAAIM survey chart can been seen by clicking here.
- Other sentiment surveys continue to rebound towards extreme optimistic levels, giving us a "sell signal". Consensus Inc survey is still rising, while Market Vane survey is at extremely bullish level with a reading of 66% bulls (same as last week). For referencing, recent Hulbert Newsletter Sentiment survey chart can be seen by clicking clicking here.
Chart 2: Overall sentiment index is approaching extremes once again!
Source: Short Side of Long
- Overall sentiment is definitely pointing towards extremes once again. Interestingly, we have now seen three "sell signals" in the row since the beginning of the year, which is stubborn bullishness by the retail investors, newsletter advisors, fund managers and institutional investors. At the same time, MSCI World Equity Index has only moved between 7 to 8 percent. The fact is, majority of the gains came from the October 2011 lows and buying this late in the rally will most likely prove to be a major mistake.
- Last weeks ICI fund flows report showed "equity funds had estimated inflows of $3.84 billion for the week, compared to estimated inflows of $7.58 billion in the previous week. Domestic equity funds had estimated inflows of $2.46 billion, while estimated inflows to world equity funds were $1.38 billion." For referencing, recent equity fund flow chart can be seen by clicking clicking here. Rydex fund flows remain at similar levels to what I discussed in previous weeks. As already stated previously, a long term buy signal only occurs when Nova Ursa ratio drops as low as 10 (like in March 2009, July 2010 and October 2011). For referencing, recent Rydex fund flow chart can be seen by clicking clicking here.
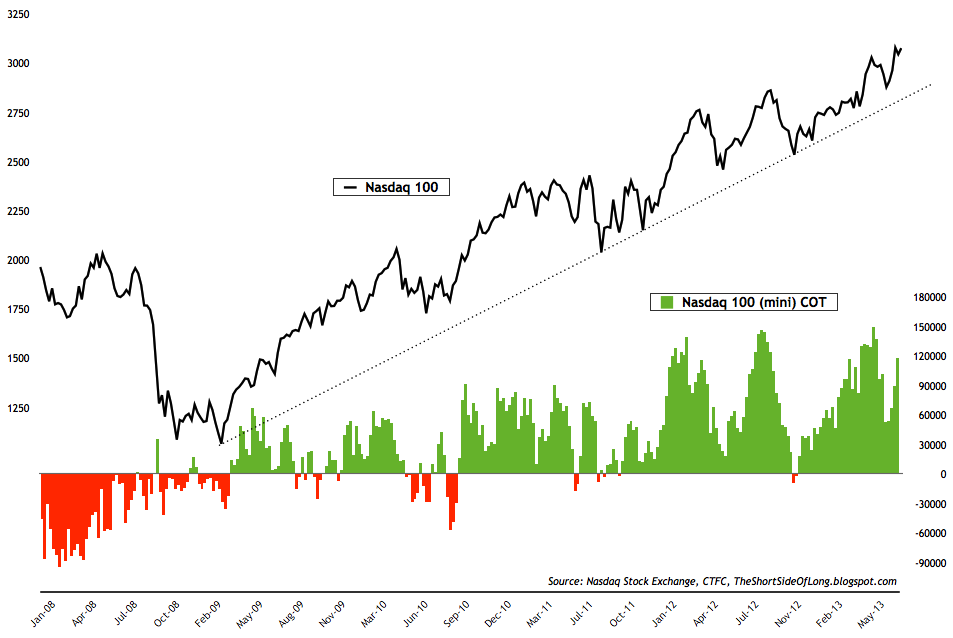
Chart 3: Fund managers are once again ramping up net long exposure
Source: Short Side of Long
- Last weeks commitment of traders report showed that hedge funds and other speculators increased their bets even further from the previous weeks readings. Net long positions now stand at 118,000 contracts, relative to previous readings of 89,000 contracts. We are now reaching extreme net long exposure, while Nasdaq 100 itself is not really marching that much higher. From a contrarian perspective, group think usually occurs near major market peaks.
Bonds
- Bond sentiment surveys remained near extreme pessimistic levels, not fluctuating too much from previous weeks update. Market Vane survey & Hulbert Newsletter Bond survey are now quite pessimistic, while Consensus Inc survey is at extreme levels usually associated with intermediate lows. For a longer term investor like myself, bonds remain extremely overvalued after a 31 year bull market. For referencing, recent Consensus Inc survey chart can be seen by clicking clicking here.
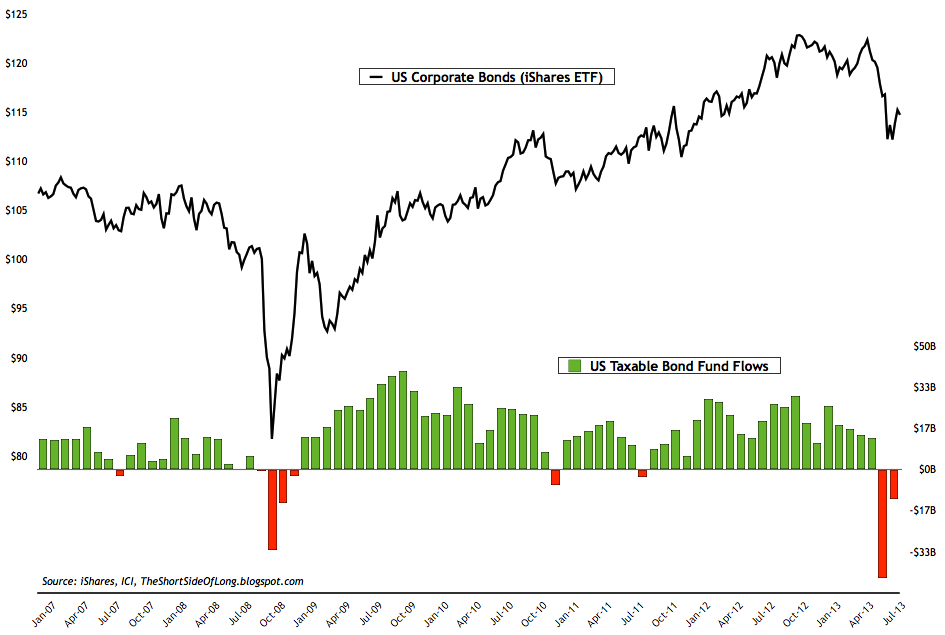
Chart 4: Capital continues to leave bonds, as inflows to equities rise
Source: Short Side of Long
- Last weeks ICI fund flows report showed "bond funds had estimated outflows of $3.49 billion, compared to estimated outflows of $8.10 billion during the previous week. Taxable bond funds saw estimated outflows of $1.04 billion, while municipal bond funds had estimated outflows of $2.46 billion." Capital is leaving bond funds for the second month in the row. As we can see from the chart above, it is large and it is constant.
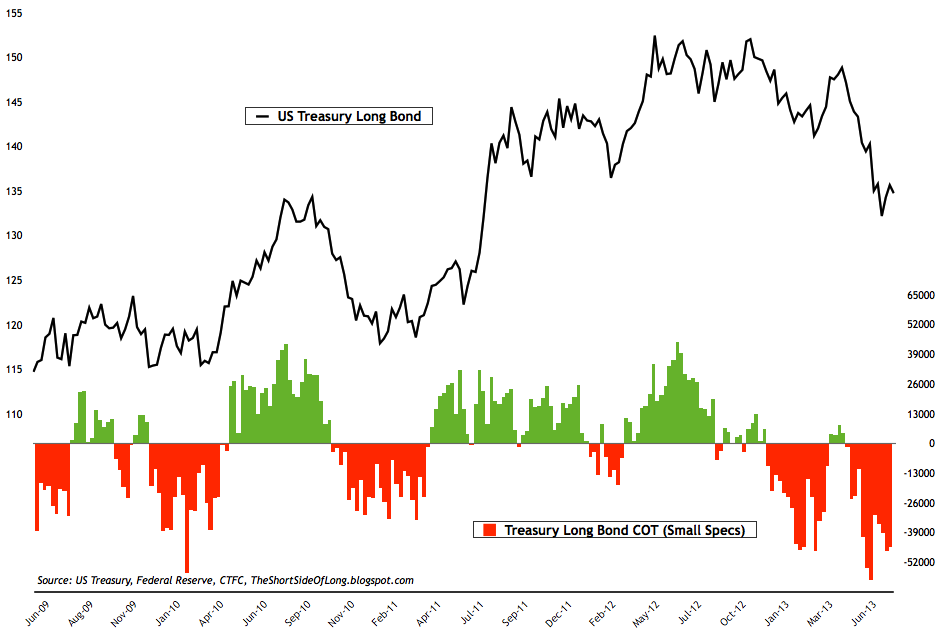
Chart 5: Recent COT report shows persistent bond net short bets!
Source: Short Side of Long
- Last weeks commitment of traders report shows that small speculators remain net short the Treasury Long Bond market with over 45,000 net short contracts, only a slight decrease from last week. As already mentioned last week, we are now approaching an extreme level of 50,000 net short bets, and speculators continue to persistently bet against the oversold bond market.
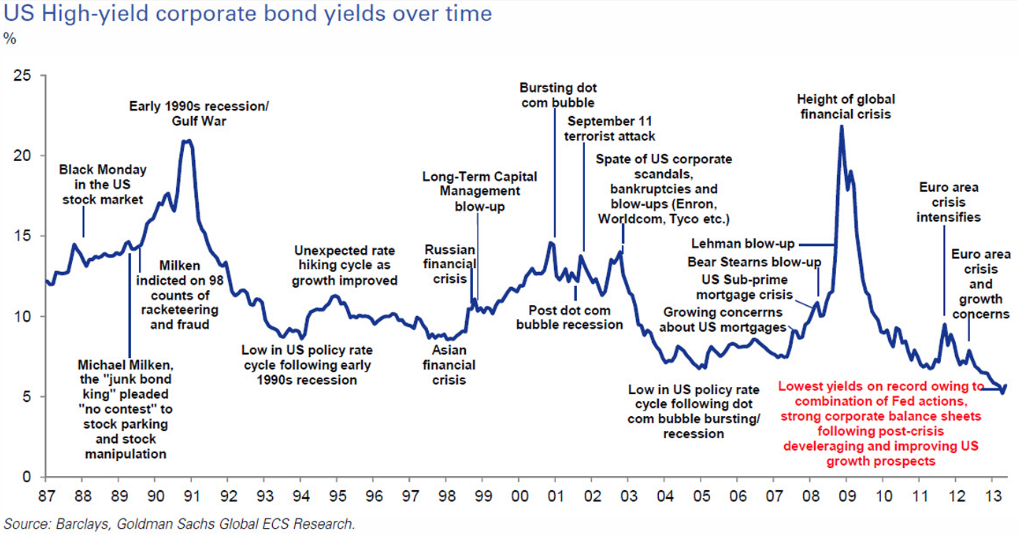
Chart 6: Junk bond yields now trade at all time record lows
Source: Barclays Research
- A side note from the sentiment update, it is worth noting that interest rates across the world are at extremely low levels. From JGBs to Treasuries to Bunds, the bond market is overvalued from a secular perspective. The bull market has lasted over 31 years and the Kondratiev Wave signals a turn at any point in time. A reversal of this trade, weather it has already started or will start eventually, will most likely result initial pressure towards marginal lower grade bonds being affected first. With Junk Bonds at the record low historical yields, up and coming debt / currency crisis will affect this asset class tremendously. Extreme caution is advised!
Commodities
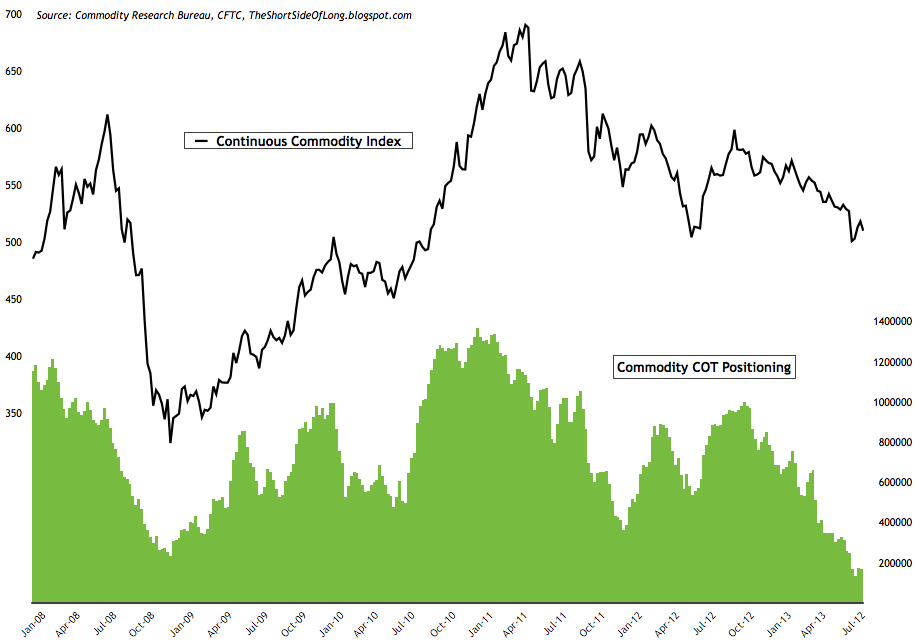
Chart 7: Hedge fund exposure to commodities still remains extremely low
Source: Short Side of Long
- Last weeks commitment of traders report showed that hedge funds and other speculators remained virtually undercharged with commodity net long exposure. Cumulative net longs decreased to 168,000 net longs, from previous weeks reading of 170,000 contracts (custom COT aggregate). Current exposure remains well below December 2008, which proved to be a major buying opportunity in the current secular bull market.
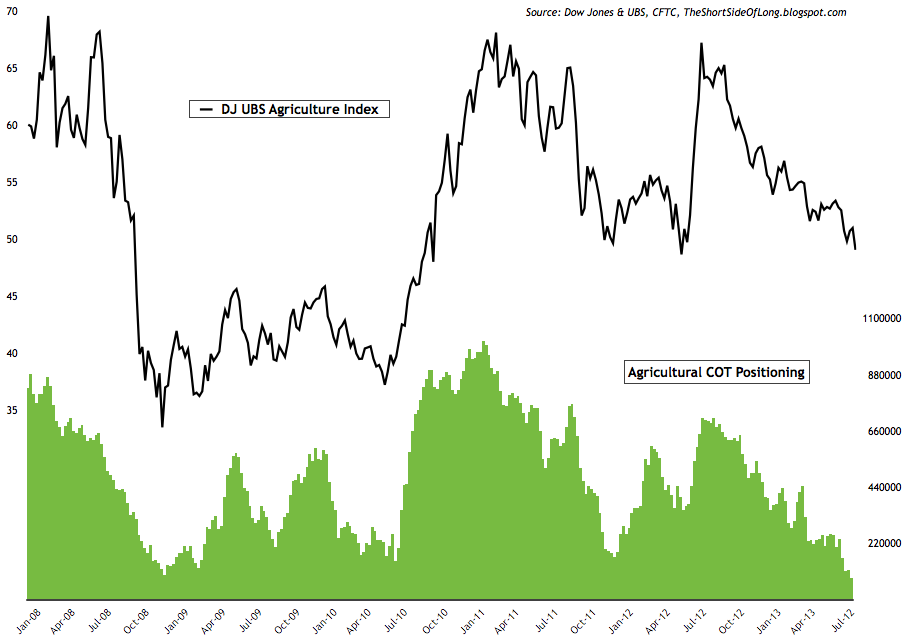
Chart 8: Hedge funds and other speculators dislike Agriculture
Source: Short Side of Long
- Exposure was reduced in Grain agriculture rather sharply, with hedge funds and other speculators holding large bets against Corn and Wheat. Other sectors all saw increases, including Soft commodities, Energy and Metals. Overall, exposure to Agri commodities is now at contrarian buy levels. If we were to witness further selling in coming weeks, this will get me very interested!
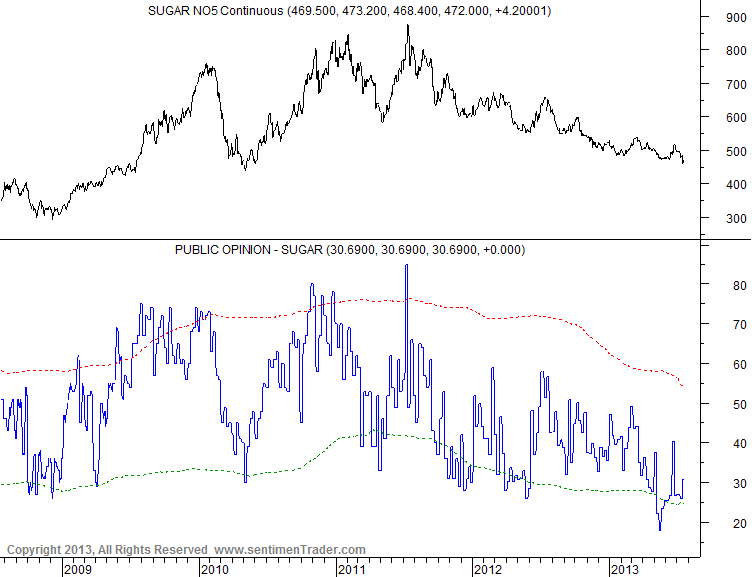
Chart 9: Sentiment remains depressed on commodities like Sugar
Source: SentimenTrader
- Commodity Public Opinion surveys still remain mixed within the commodity complex. As energy rallies, sentiment has risen above neutral levels. On the other hand, agricultural commodities and metals still remain under pressure. Sentiment on metals and soft commodities is unloved territory, in particular Sugar as can be seen in the chart above.
Currencies
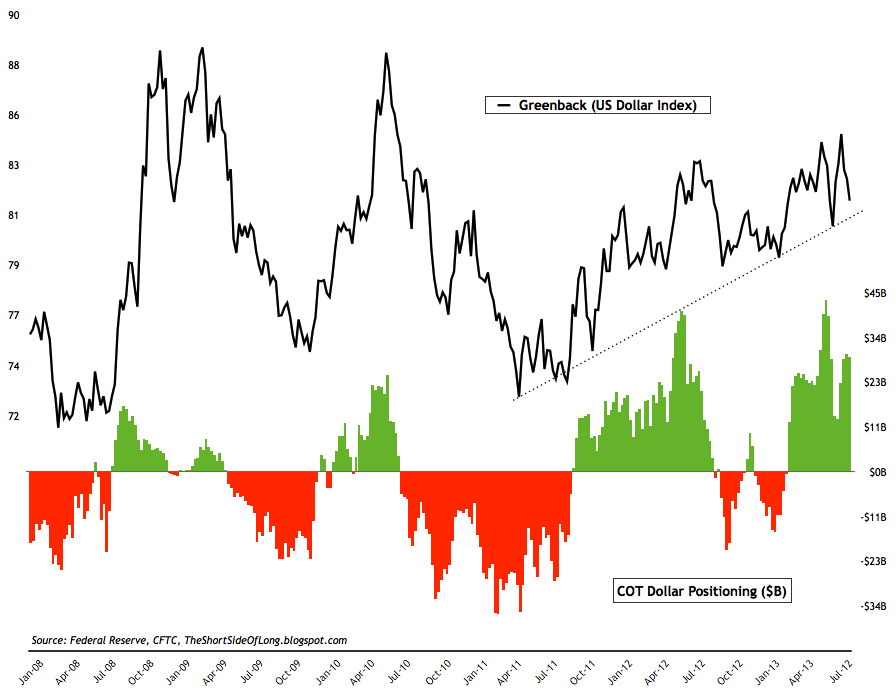
Chart 10: Speculators remain stubbornly bullish the US Dollar
Source: Short Side of Long
- Last weeks commitment of traders report showed growing exposure towards the US Dollar decreased only slightly from the previous weeks readings. While cumulative positioning by hedge funds and various other speculators stood very close to $30 billon last week, the current update shows speculators now hold around $29 billion net long contracts.
Chart 11: One of the most hated currencies in recent months is the Yen!
Source: Short Side of Long
- Hedge funds hold short bets against all foreign currencies. In particular, Japanese Yen has stood out in last few months as the most hated major currency. Speculators have amassed huge short bets at over $10 billion on consistent basis for months on end. Since markets almost always mean revert (eventually), the longer the current group think continues to sharper the short squeeze will be. During the recent sell off, yen failed to make a new low, so trades who are short the currency should start paying attention.
- Currency Public Opinion survey readings on the US Dollar reverted back towards the mean after the recent US Dollar correction. At the same time, Public Opinion on the foreign currencies has bounced from the extremely pessimistic readings we saw a few weeks ago. All in all, nothing major to report here.
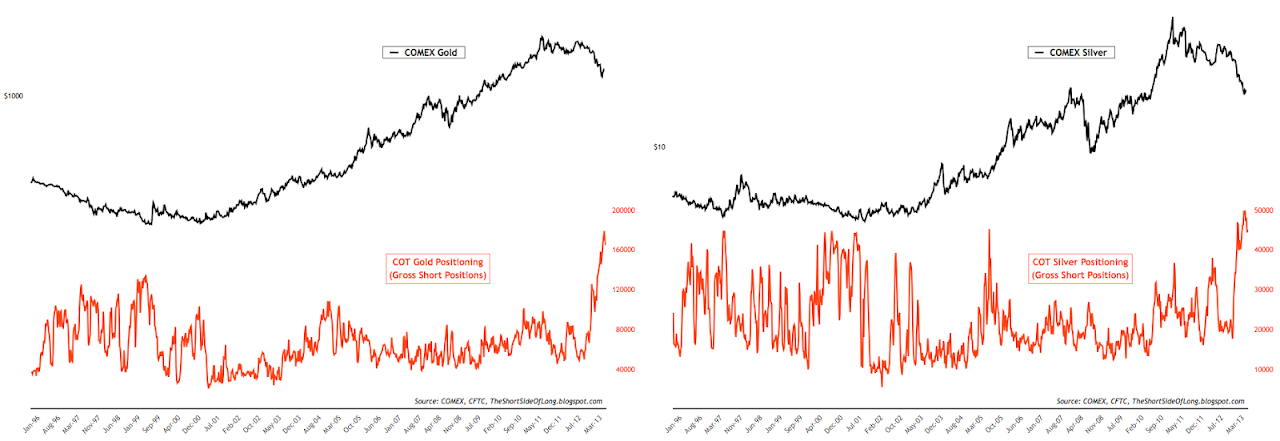
Chart 12: Gold traders have started covering their record net short bets!
Source: Short Side of Long
- Last weeks commitment of traders report showed hedge funds and other speculators continue to add exposure back to the precious metal sector. Hedge fund positions on Gold increased to 34,000 while in Silver, hedge funds decreased their bets only slightly to 5,700 net longs. The question of weather hedge funds are really buying can be answered with the chart above, which shows that Gold and Silver bears have started covering their record short positioning and in turn creating buying pressure (also known as a short squeeze).
- Public opinion on alternative currencies like Gold and Silver still continues to remain depressed, which is confirming the ultra bearish COT reports discussed above. Bear market is still in progress but there are signs that we are finally bottoming out.


