


In this week's SIA Equity Leaders Weekly we are going to revisit both the TSX Composite Index and also Crude Oil, to see if anything has changed since we last looked at both of these charts. It is important to remember that Canadian Equity currently sits in the fourth spot in the SIA Asset Allocation Model and Commodities are in seventh, so we are not recommending to be over-weighting these areas right now, but they are still good to look at for potential signs of change for those advisors who do focus more frequently in these areas.
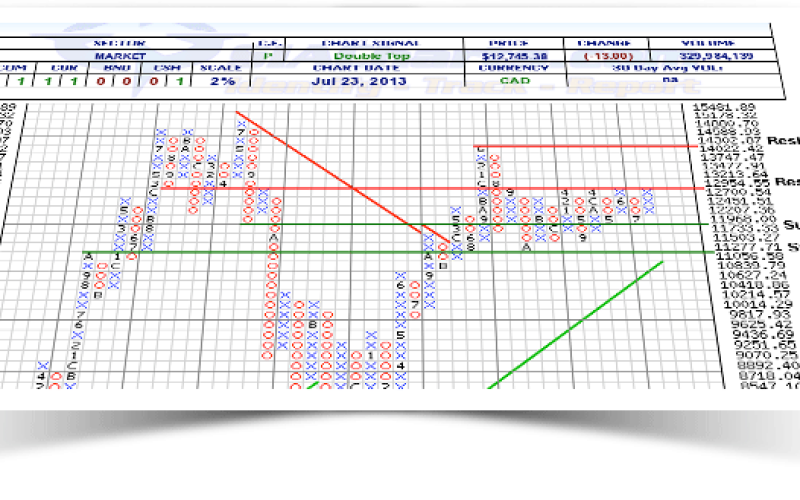
S&P/TSX Composite (TSX.I)
Looking at the chart we can see that since we last looked at the TSX.I almost 2 months ago, the channel has remained intact and that once again the composite is banging up against the top end at major resistance of 12954.55. With the recent strength we have seen in oil (see chart below) and also the bounce in some of the metals and mining stocks, this participation has made the recent move up to resistance more broadly based than we may have been seeing previously. Should the channel break to the upside then the next resistance level is going to be at 14302.87.
Support is now at 11733.33 and again below that at 11056.58, which will also correspond with the rising trend line. A word of caution exists as the SMAX currently sits at a neutral 5, showing near term weakness against our stronger asset classes in Equities and Bonds.
Click on Image to Enlarge
Crude Oil Continuous Contract (CL.F)
Support is now found at $95.20 and below this at the $82.12 level, with additional support coming from the rising trend line in between those two levels. The short term SMAX has also strengthened since we last looked at Crude, now showing a strong 9.
Watching these resistance levels on both of these charts will be important for those who are interested in these areas as failure to break through could result in some continued periods of consolidation and lack of growth.
Click on Image to Enlarge

SIACharts.com specifically represents that it does not give investment advice or advocate the purchase or sale of any security or investment. None of the information contained in this website or document constitutes an offer to sell or the solicitation of an offer to buy any security or other investment or an offer to provide investment services of any kind. Neither SIACharts.com (FundCharts Inc.) nor its third party content providers shall be liable for any errors, inaccuracies or delays in content, or for any actions taken in reliance thereon.
Copyright © SIACharts.com