By EconMatters
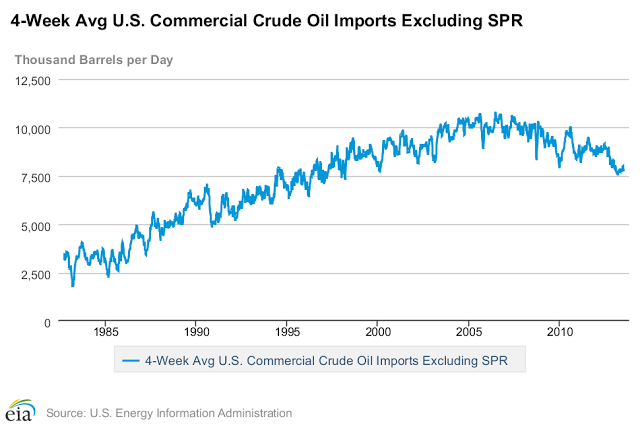
Imports Down 3 Million (barrels per day) since 2006
Oil imports are trending down and stand approximately 7.5 million barrels per day, which is the lowest level since the year 2000. This number hit its highest on a 4-week average basis of around 10.5 million barrels being imported back in 2006.
This is a reduction of 3 million barrels per day, and when you start adding these reductions up, one can see the magnitude of oil that is no longer coming to the United States. Take 3 million barrels times 7 days in a week, and we get a reduction of 21 million barrels of oil for a week.
I broke the numbers down this way so that readers could wrap their minds around the numbers, and how they were derived. The numbers will fluctuate on a monthly basis due to how many days are in a month.
Therefore, the easiest way to get the annual reduction in imports number is to take the 3 million barrels per day figure times 365 days in the year which equals 1 Billion 95 million barrels of oil annually from the peak level of imports established in 2006.
In order to back into the monthly number just divide by 12 and the US on average is importing approximately 91 million barrels less oil per month rounding down to simplify the numbers.
Of course, these are just averages and ports can be closed for holidays, shipments are higher and lower throughout the days of the week to get the overall daily average for the week.
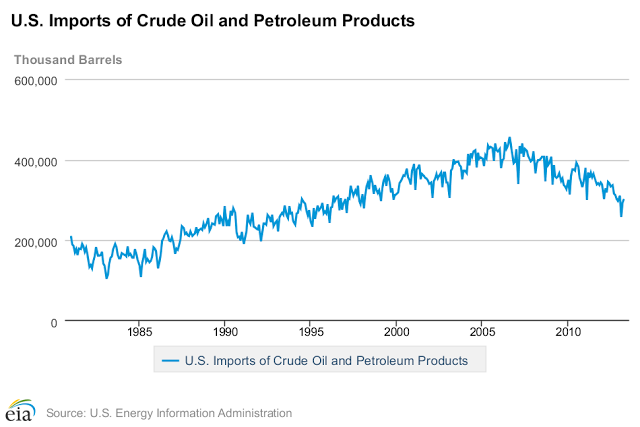
The number is even greater when you add in other imported petroleum products from 2006 besides just strictly oil imports.
This is a reduction of oil imported every year, and when one looks at these numbers on a five, ten year time horizon the numbers became staggering to comprehend.
This is the real reason the Brent-WTI oil spread has collapsed, not because Cushing Oil inventories have gone down, but because all this oil that used to come to the US is now flooding the global markets, and weighing heavily on Brent prices.
Cushing Oklahoma Inventories
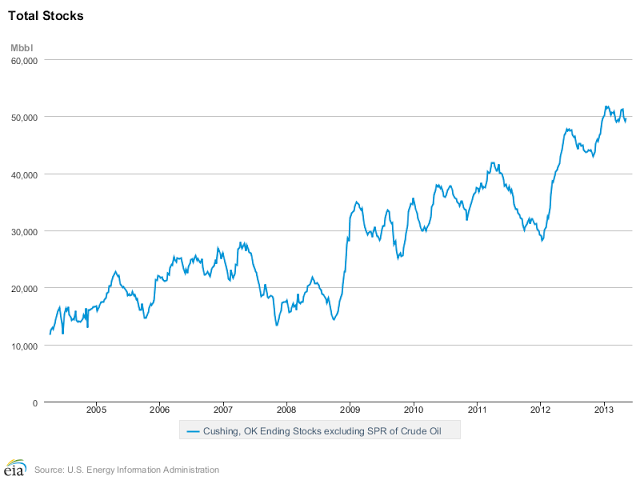
For all those who believe that Cushing Oklahoma inventories have dramatically gone down due to the all the pipeline and rail transportation options being developed take a look at the actual data.
Cushing inventories stand at 46.1 million barrels versus 46.3 million barrels this time last year, and this is after a backwardation market event that creates incentive to liquidate inventories.
Given that the gasoline demand number last week dropped dramatically, and gasoline supplies are high for this time of year, meaning refining utilization rates will start declining, oil inventories at Cushing will start rising again, and should finish the year at a record above 50 million barrels of oil.
The other factor worth noting is that since all the oil that used to flow to the US is now stuck overseas, pressuring Brent prices, all the trading capital that used to be in Brent, has now come back to the WTI contract.
Ergo, part of the reason the spread has collapsed is because oil speculators wanting to match their enthusiasm for stock prices, do it through WTI and not Brent Futures.
These fund flows wanting to match fund flows in equities have resulted in considerable pressure on the spread, and have moved contrary to the actual inventories at Cushing, which are as high as last year when the Brent-WTI Spread was $25.
This debunks the oil analysts that state the reason for the spread collapsing is that the ‘land-locked’ Cushing Oil is no longer stuck in Cushing and thus available for the global oil price. Without an active oil export market, and given the amount of global oil that has nowhere to go, i.e., stuck overseas Cushing Oil is as ‘land locked’ as ever.
Total US Oil Inventories
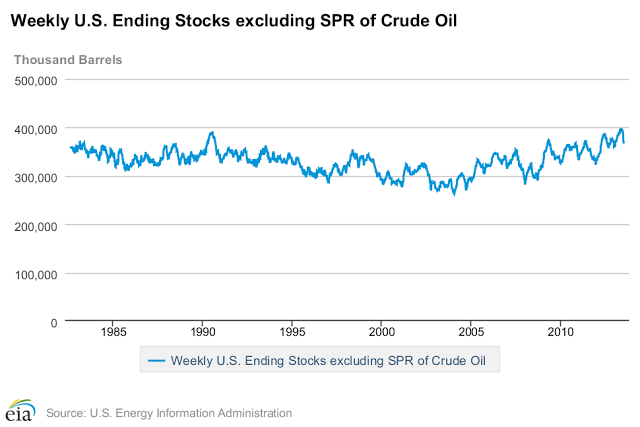
Although total US oil inventories have been reduced the last three weeks by some 26 million barrels, inventories were coming off of record highs, this is the highest demand time of the year with refining utilization rates at their highest, and the market was in backwardation.
It should be noted that inventories are still extremely high, and the upward trend of increasing inventories started in 2004 is definitely still in place, with each year ending in higher oil being stored than the previous year.
As the summer driving season peaks, and refinery rates start going back into the 80`s, products being well supplied, expect these total inventory numbers to start building again.
Domestic Production
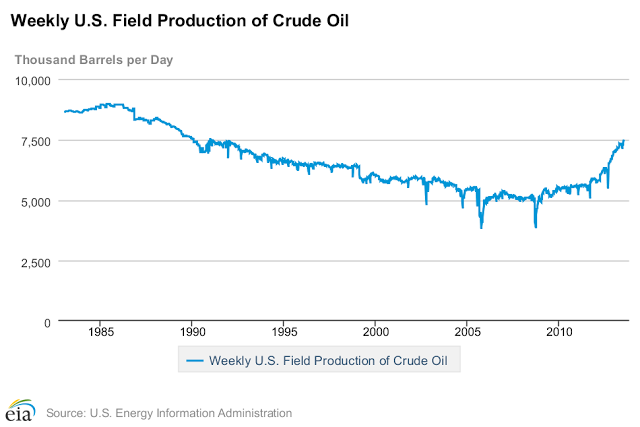
This brings us to the biggest change in the oil market for the last 20 years, the incredible rise of US production. The US could possibly hit the 8 million barrels per day number faster than analysts thought, maybe as soon as the first quarter of 2014.
Where Does International Oil Go?
The optimistic oil crowd will point to global markets, that global demand will fill the gap regarding increased oil available internationally due to the substantial reduction in US imports.
But as many commodity analysts have properly assessed the commodity bull cycle is over, mainly fueled by China which was basically building a new city every month at its zenith of a residential relocation and industrial growth phase.
This Rural to Industrial Transformation Era in China is complete. China now has infrastructure capacity limits like pollution, congestion, over-population, over-building, debt concerns, property bubbles, and entering a more mature growth phase where quality not quantity takes primal importance.
We can see this in all the other commodity prices like iron-ore, copper, steel, etc. that China is longer going to be able to single handedly prop up commodities like it has for the last 15 years.
It is obvious that oil is going to be much cheaper in the future, and this is even with multiple OPEC production cuts, there just is too much oil being produced versus the oil being consumed each day.
Eventually the current trend of building more storage to neutralize too much supply reaches its limits and prices come down until demand outpaces supply.
The EIA doesn`t expect this in 2014, and has reported that supply will continue to outpace demand for the next two years.
The world can only build so much storage to store extra supply; at some point demand has to eat up this extra supply. Prices have to come down significantly to help improve the demand side of the equation. This is simple economics 101 folks!
© EconMatters All Rights Reserved


