by Charts, Etc.
At the end of May, I wrote about how crude oil had been lagging the performance of energy equities and in my experience, equities tended to lead their associated commodity. That said I wrote then, "I would expect that with the RYE flirting with new highs, the multi-month divergence between energy equities and crude oil will be closed via the commodity (WTI) rallying from here."
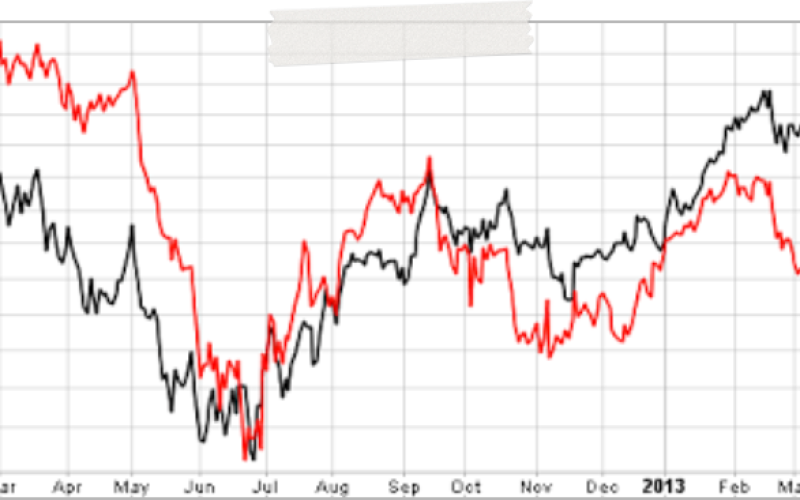
The updated daily chart below shows that crude oil (WTI, red line) has indeed caught up with equities (RYE) over the last several weeks.
Source: Stockcharts.com
Energy stocks, as represented by the Guggenheim S&P 500 Equal-Weight Energy ETF (RYE, black line), remain in a nice uptrend, but how does crude oil look technically?
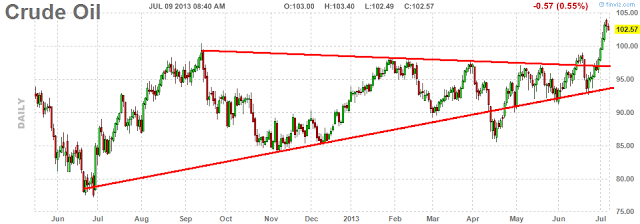
I've been bullish on crude for some time and it was one of my first entries for this blog. The daily chart continues to look very bullish:
Source: Finviz
A few weeks ago, crude made an attempt at breaking out of the ascending triangle formation only to pullback (very common occurrence). After reloading, it then made a dramatic breakout this month, driven by events in Egypt.
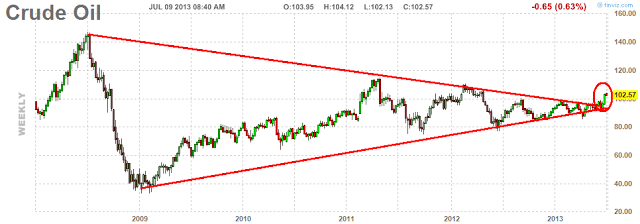
Early last month, I wrote about the massive triangle formation developing in crude oil's weekly chart. With this recent run-up in price, it appears a breakout of this triangle has successfully occurred:
Source: Finviz
I would expect a price retreat back to the $100 level and some consolidation before further price gains unfold. Of course, much depends on geopolitical circumstances, but I would remind the chart for crude oil has looked bullish for many months, not just of late. And this despite the steady flow of news stories reporting how we're awash in cheap oil (and gas) thanks to new methods of drilling and extraction (read: fracking). Peak oil is dead we're told. That may be true, but judging from crude oil's chart it's likely very premature to make such definitive statements.


