Another Breakdown for Bonds
by Carl Swenlin, StockCharts Blog
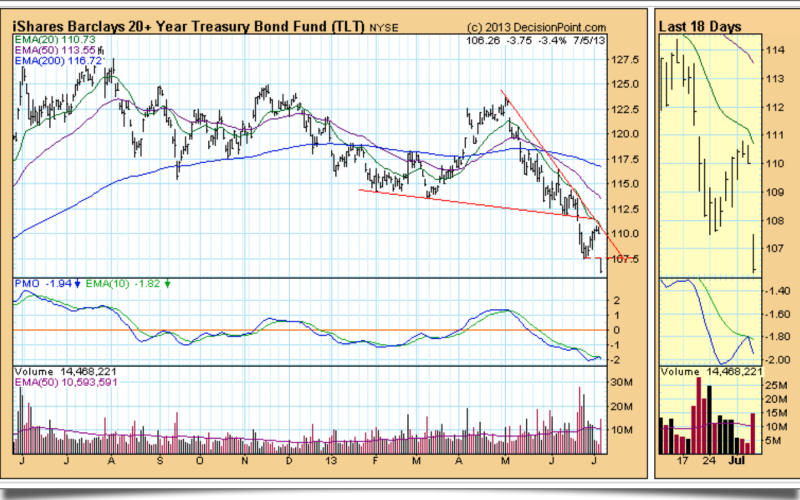
Last week TLT, our bond market surrogate, made a new low, then bounced up to the resistance of the declining tops line drawn from the May top. It turned down on Wednesday, we thought beginning a move to test the recent low, but today TLT didn't bother to retest the low. It gapped down below the support and kept heading south.

The situation is more obvious on the weekly chart. A massive top has been forming over the last two years, and price is headed toward support at 105. We are tempted to say that it is all over for bonds, but we can see that bond prices are nothing if not volatile. It is notable that the weekly PMO (Price Momentum Oscillator) has reached a level where it has previously found support.

Conclusion: TLT is near long-term support in price and internally, so a bounce in price is possible; however, the rise to over 125 was excessive in speed and amplitude, and we think that a more extended correction is needed.
Copyright © StockCharts Blog