For this weeks edition of the SIA Equity Leaders Weekly, we will be updating the U.S. Dollar vs. the Canadian Dollar, a subject that we touched on in early May as we saw a potential bullish pattern develop. Secondly, we will take a look at the 30 Year Interest Rate in the U.S. as its movement upwards over the past year is putting pressure on bond holdings within your portfolios and will affect other asset classes as moneys move out of the long end of the yield curve.
United States Dollar/Canadian Dollar (USDCAD)
Our first chart today is the USDCAD. This chart has been in a consolidation pattern since the latter part of 2010 with the exception of a spike down in 2011. Looking to the chart today we see that we are currently sitting at key resistance below 1.0639 with a close above suggesting that we could see room to the 1.1752 range.
For the past 21 months we have seen U.S. Equities dominate their Canadian counterparts but with the potential for a breakout on the USDCAD, this relationship could get more skewed in favor of U.S. Equities. For those who have not already maxed out their U.S. exposure within their portfolios watching this chart could give you an opportunity to get another opportunity if we see the breakout complete.
Click on Image to Enlarge

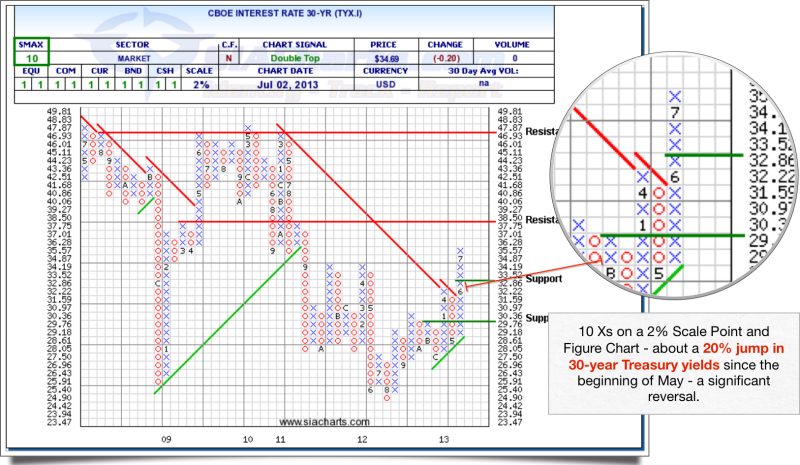
CBOE Interest Rate 30 - YR (TYX.I)
With all of the volatility that we have witnessed over the past few weeks in the Bond universe, the TYX.I has continued to move upwards and is moving towards the next resistance level at 3.85%. This continued strength is applying additional pressure to investments on the long end of the yield curve. Further strength may then see the next resistance at 4.787% come in to play, which is a level last seen in 2009 -2011.
Support to the downside has now moved up to 3.286% and again below that at 2.976%. With the SMAX at 10, TYX.I is showing short term strength against all the asset classes.
We continue to see U.S. Equity as the strongest asset class in the SIA Asset Allocation rankings, with Bonds having now moved up in to second place overall. This recent move is not necessarily stating we are seeing strength in Bonds but rather that we are seeing weakness in the Asset classes beneath it.
Click on Image to Enlarge

Copyright © SIACharts.com