


by Don Vialoux, TechTalk
Pre-opening Comments for Thursday July 4th
Canadian equity prices are expected to open higher this morning. Prices are expected to respond to overnight strength by U.S. equity index futures and stronger European and most Asian equity markets. S&P 500 futures were up 7 points in pre-opening trade. Major European equity indices averaged a gain in excess of 1.0%.
Trading activity on the TSX is expected to be well below average today due to the U.S. Independence Day holiday. U.S. markets are closed.
European equity markets were virtually unchanged following news that the Bank of England and the European Central Bank maintained their overnight lending rate at 0.5%.
Interesting Chart
Crude oil moved above another resistance level yesterday on move above $100.42. Technical score remains 3.0 out of 3.0.

Weekly Technical Review of Select Sector SPDRs
Technology
· Downtrend remains
· Units remain below their 20 and 50 day moving average.
· Strength relative to the S&P 500 Index changed from negative to neutral
· Technical score improved from 0.0 to 0.5 out of 3.0
· Short term momentum indicators are trending up.

Materials
· Trend remains down
· Units remain below their 20 and 50 day moving averages
· Strength relative to the S&P 500 remains negative.
· Technical score remains at 0.0 out of 3.0
· Short term momentum indicators are oversold
Industrials
· Downtrend remains intact.
· Units remain below their 20 and 50 day moving averages
· Strength relative to the S&P 500 Index changed from positive to negative
· Technical score improved changed from 1.0 to 0.0
· Short term momentum indicators are trending up.

Consumer Discretionary
· Trend changed from down to neutral on a move above $57.20.
· Units remain above their 20 and 50 day moving averages.
· Strength relative to the S&P 500 Index remains positive.
· Technical score improved from 2.0 to 2.5 out of 3.0
· Short term momentum indicators are trending up.

Financials
· Trend remains down.
· Units moved below their 20 day moving average
· Strength relative to the S&P 500 Index changed from 2.0 to 0.5 out of 3.0
· Short term momentum indicators are trending up.

Energy
· Trend remains down.
· Units remain below their 20 and 50 day moving averages
· Strength relative to the S&P 500 Index changed from negative to neutral
· Technical score changed from 0.0 to 0.5
· Short term momentum indicators are trending up.

Consumer Staples
· Trend remains down
· Units remain below their 20 and 50 day moving averages
· Strength relative to the S&P 500 Index remains neutral
· Technical score remains at 0.5
· Short term momentum indicators are trending up.

Health Care
· Trend remains down.
· Units moved below their 20 and 50 day moving averages
· Strength relative to the S&P 500 Index remains neutral.
· Technical score changed from 1.5 to 0.5 out of 3.0.
· Short term momentum indicators are neutral

Utilities
· Trend remains down.
· Units moved below their 20 day moving average
· Strength relative to the S&P 500 Index changed from positive to neutral.
· Technical score changed 2.0 to 0.5
· Short term momentum indicators are trending up.

Special Free Services available through www.equityclock.com
Equityclock.com is offering free access to a data base showing seasonal studies on individual stocks and sectors. The data base holds seasonality studies on over 1000 big and moderate cap securities and indices. Notice that most of the seasonality charts have been updated recently.
To login, simply go to http://www.equityclock.com/charts/
Following is an example:
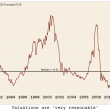
CNQ.TO Relative to the S&P 500

Disclaimer: Comments and opinions offered in this report at www.timingthemarket.ca are for information only. They should not be considered as advice to purchase or to sell mentioned securities. Data offered in this report is believed to be accurate, but is not guaranteed.
Don and Jon Vialoux are research analysts for Horizons Investment Management Inc. All of the views expressed herein are the personal views of the authors and are not necessarily the views of Horizons Investment Management Inc., although any of the recommendations found herein may be reflected in positions or transactions in the various client portfolios managed by Horizons Investment Management Inc
Horizons Seasonal Rotation ETF HAC July 3rd 2013
![clip_image002[5]](http://www.timingthemarket.ca/techtalk/wp-content/uploads/2013/07/clip_image0025.png "clip_image002[5]")
Copyright © TechTalk


