Pre-opening Comments for Friday June 21st
U.S. equity index futures are higher this morning. S&P 500 futures rose 6 points in pre-opening trade. Index futures were helped by news that the Bank of China provided a liquidity injection valued at $65 billion in overnight trade.
Volume on U.S. exchanges is expected to remain at above average levels today due to quadruple witching (i.e. the last trade day for June equity and index futures and options).
Canadian economic data released at 8:30 AM EDT came in lower than expected. Consensus for May Consumer Prices was an increase of 0.4% versus a decline of 0.2% in April. Actual was an increase of 0.2%. Year-over-year CPI increased only 0.7%. Consensus for April Retail Sales was an increase of 0.2% versus no change in March. Actual was a gain of 0.1%. The Canadian Dollar moved lower on the news.
Oracle fell $2.51 to $30.70 after reporting slightly lower than expected fiscal fourth quarter revenues.
Facebook added $0.62 to $24.52 after announcing the inclusion of 15 second video feed on its service. Also, UBS upgraded the stock from Neutral to Buy and raised its target price from $28 to $30.
Newmont Mining (NEM $29.75) is expected to open lower after UBS downgraded the stock from Buy to Neutral.
Southern Companies gained $0.38 to $42.86 after Citigroup upgraded the stock from Neutral to Buy.
Follow Up Yesterday Morning to Tech Talk’s Appearance on BNN Television Last Friday
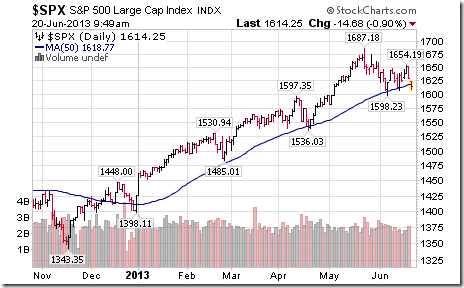
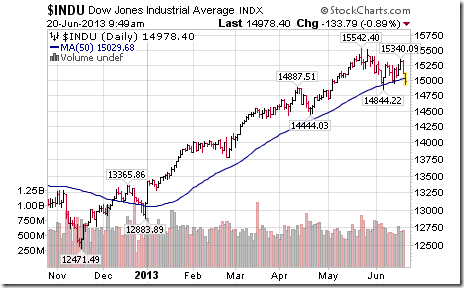
Tech Talk noted during the appearance that “If the S&P 500 Index and the Dow Jones Industrial Average fall below their 50 day moving averages, look out below”. The following comment was forwarded to BNN yesterday morning:
An important technical breakdown happened this morning when the S&P 500 Index dropped below its 50 day moving average at 1619 and the Dow Jones Industrial Average fell below its 50 day moving average at 15,029. During the past six months, their 50 day moving averages proved to be support. Their break below their 50 day moving averages confirms that the S&P 500 Index entered an intermediate corrective phase on May 22nd at a high of 1,687.18. Simultaneously, the Dow Jones Industrial Average entered an intermediate corrective phase at a high of 15,542.40. Their break has triggered additional technical selling this morning.
Look for additional technical selling if the S&P 500 Index breaks price support at 1,598.23 and the Dow Jones Industrial Average breaks price support at 14,844.22. First downside technical targets on a break below price support are 1,514 for the S&P 500 Index and 14,175 for the Dow Jones Industrial Average
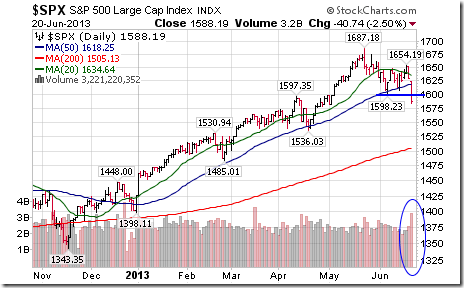
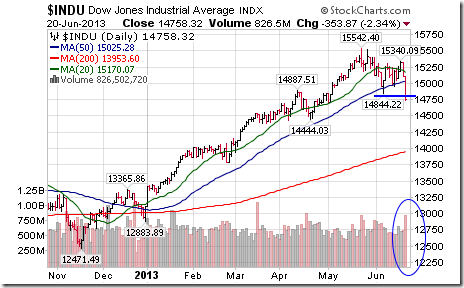
Subsequent Response by the S&P 500 Index and the Dow Jones Industrial Average
Both indices subsequently broke support on higher than average volume and established new downtrends.
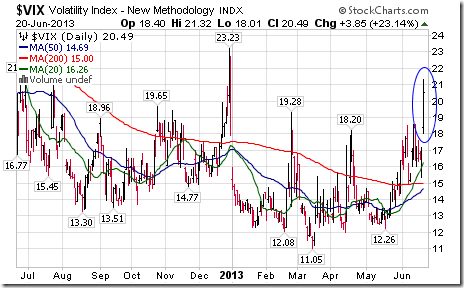
The VIX Index spiked implying an increase in investor fears.
Weekly Technical Review of Select Sector SPDRs
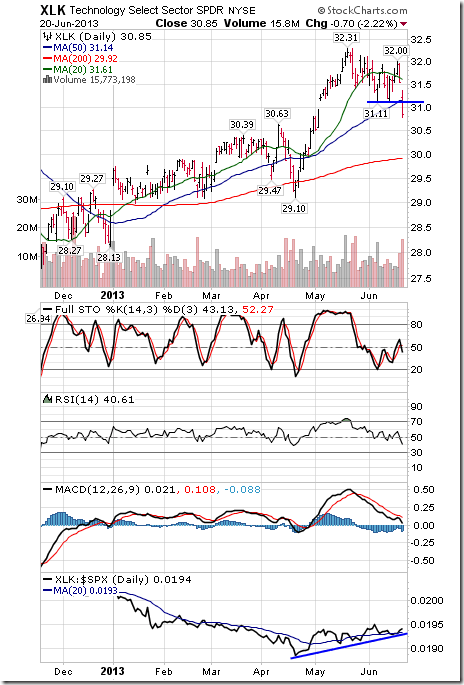
Technology
· Downtrend was confirmed on a break below $31.11
· Units remain below their 20 day moving average and fell below its 50 day MA
· Strength relative to the S&P 500 Index remains positive
· Technical score based on the above indicators remains at 1.0 out of 3.0
· Short term momentum indicators are neutral.
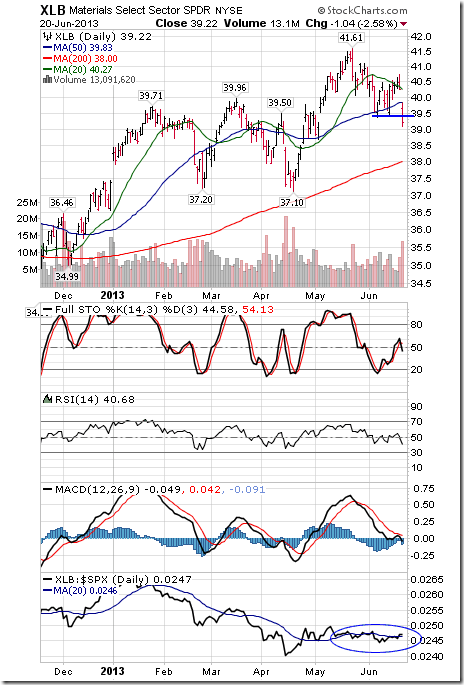
Materials
· Downtrend was confirmed on a move below $39.36.
· Units remain below their 20 day moving average and fell below their 50 day MA
· Strength relative to the S&P 500 Index improved from negative to neutral.
· Technical score based on the above indicators improved from 0.0 to 0.5
· Short term momentum indicators remain neutral.
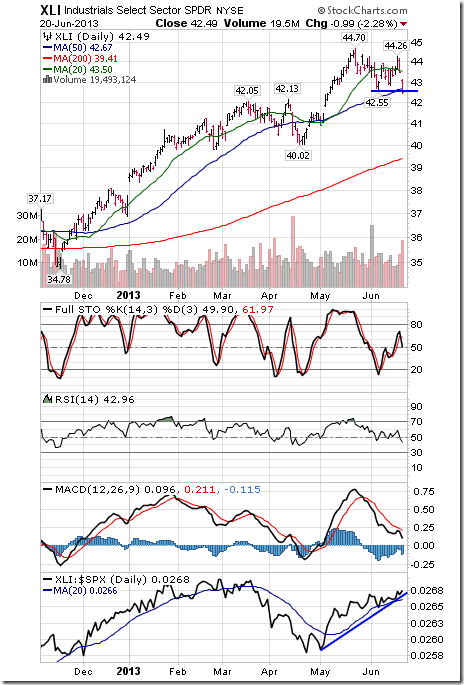
Industrials
· Downtrend was confirmed on a move below $42.55
· Units remain below their 20 day moving average and fell below their 50 day MA
· Strength relative to the S&P 500 Index remains positive
· Technical score remains at 1.0 out of 3.0
· Short term momentum indicators are neutral.
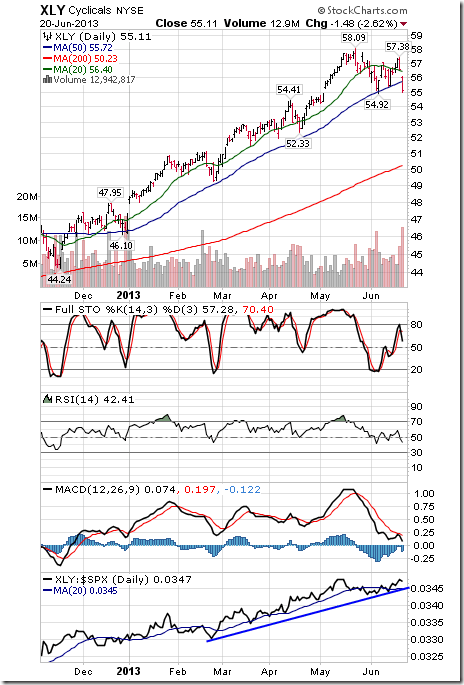
Consumer Discretionary
· Trend remains down.
· Units remain below their 20 day moving average and fell below its 50 day MA
· Strength relative to the S&P 500 Index changed from negative to positive.
· Technical score improved 0.0 to 1.0 out of 3.0
· Short term momentum indicators are neutral.
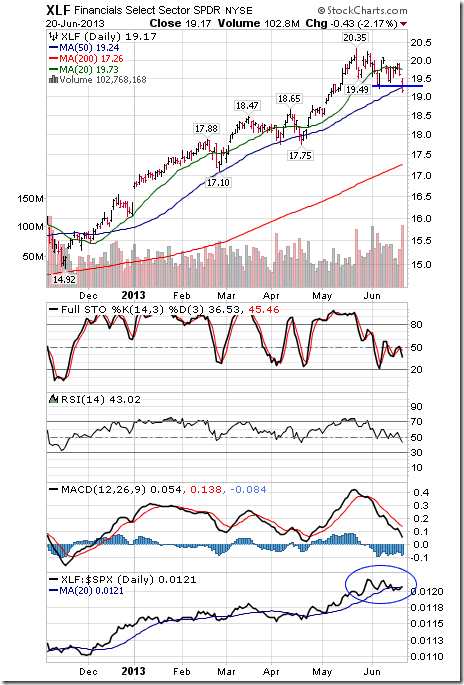
Financials
· Downtrend was confirmed on a move below $19.22.
· Units remain below their 20 day moving average and fell below its 50 day MA
· Strength relative to the S&P 500 Index remains neutral.
· Technical score remains at 0.5 out of 3.0
· Short term momentum indicators are neutral
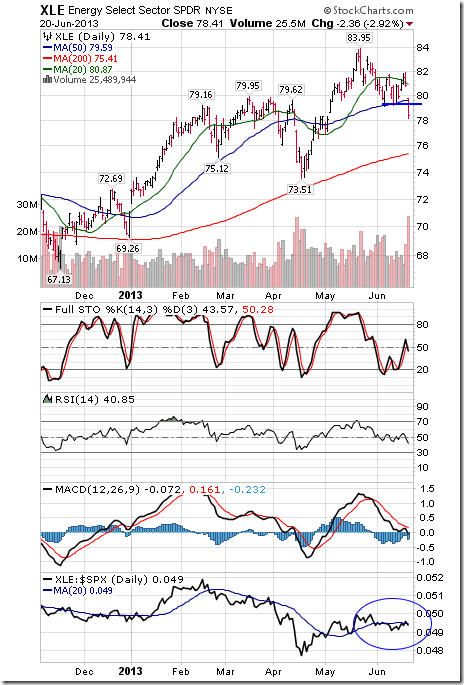
Energy
· Downtrend was confirmed on a break below $79.10.
· Units remain below their 20 day moving average and moved below their 50 day MA
· Strength relative to the S&P 500 Index changed from negative to neutral.
· Technical score improved from 0.0 to 0.5.
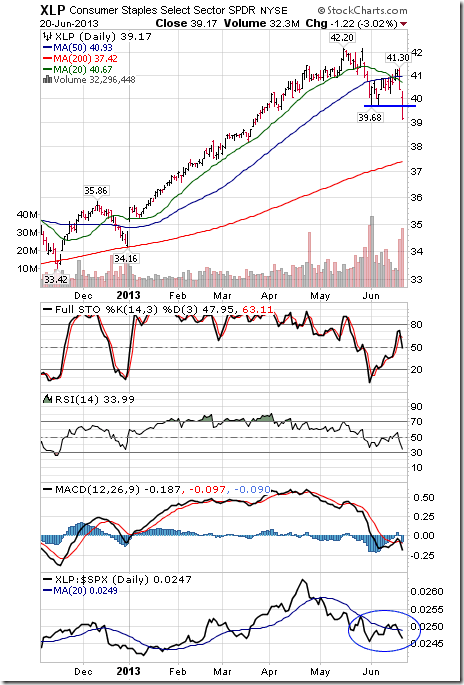
Consumer Staples
· Trend changed from neutral to negative on a move below $39.68.
· Units remain below their 20 and 50 day moving averages
· Strength relative to the S&P 500 Index changed back from neutral to negative
· Technical score slipped from 1.0 to 0.5
· Short term momentum indicators are neutral.
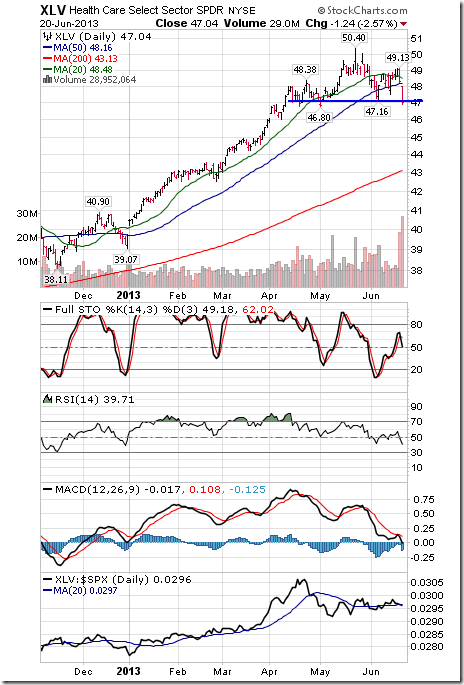
Health Care
· Downtrend was confirmed on a move below $47.16 (Head & Shoulders pattern)
· Units remain below their 20 day moving average and fell below their 50 day MA
· Strength relative to the S&P 500 Index remains neutral.
· Short term momentum indicators are neutral.
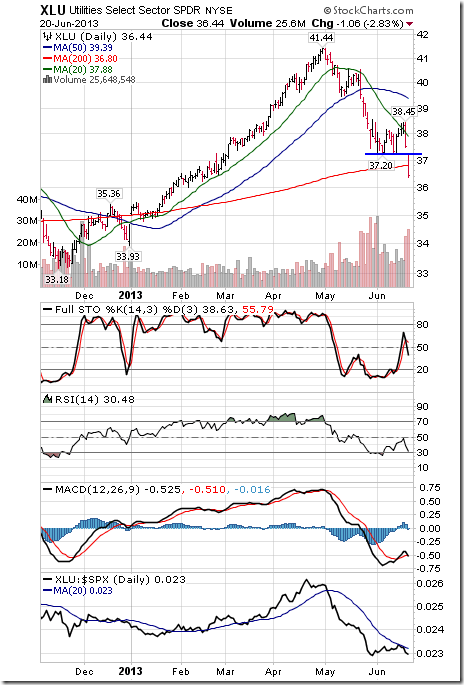
Utilities
· Downtrend was confirmed on a move below $37.20.
· Units remain below their 20 and 50 day moving averages
· Strength relative to the S&P 500 Index remains negative.
· Technical score remains at 0.0 out of 3.0
· Short term momentum indicators are neutral
Other Interesting Charts
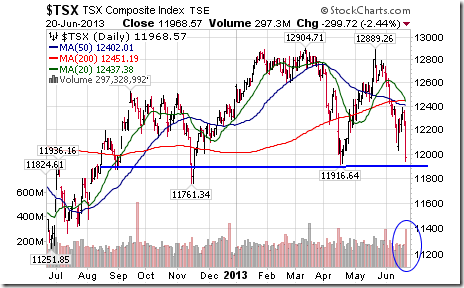
The TSX Composite Index completes a massive head and shoulders pattern on a break below support at 11,916.64.
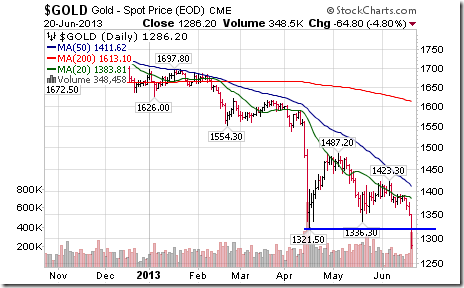
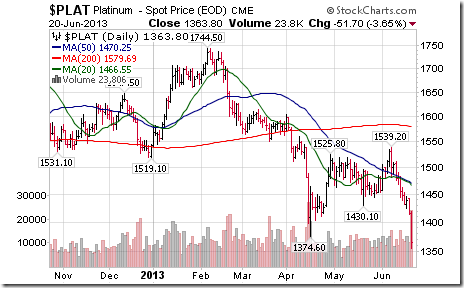
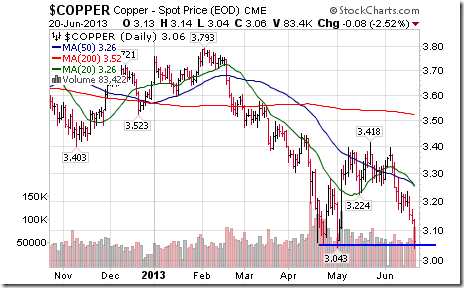
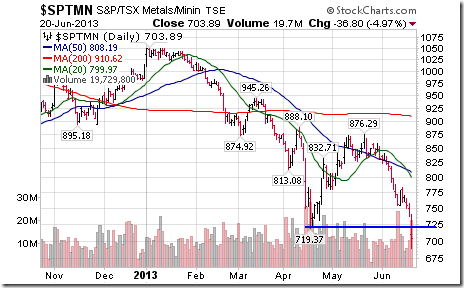
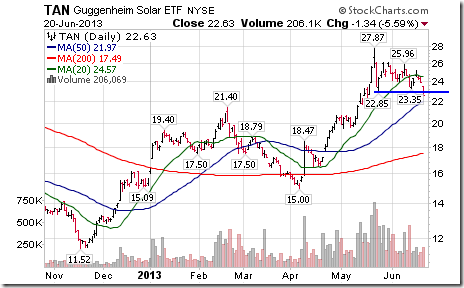
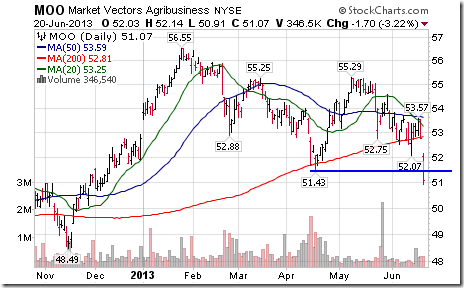
Commodity prices and commodity equity prices were hit hard on strength in the U.S. Dollar as well as news of a slowdown in China’s economic growth.
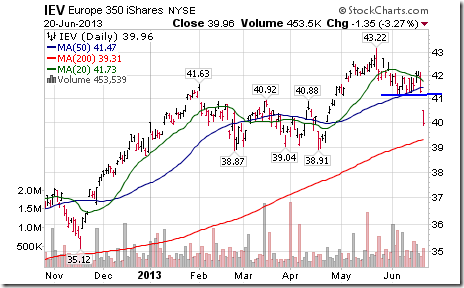
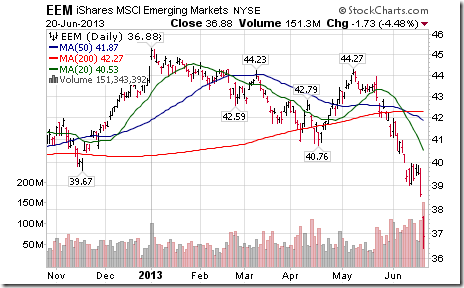
Equity markets outside of North America also recorded significant technical deterioration.
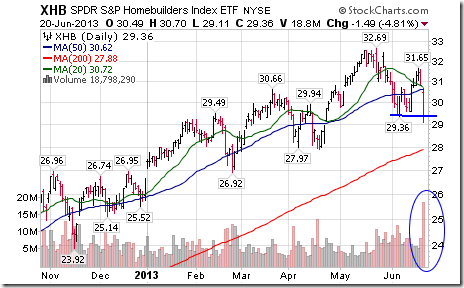
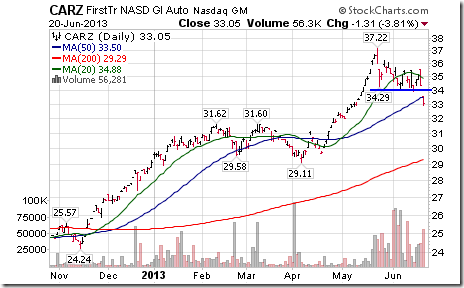
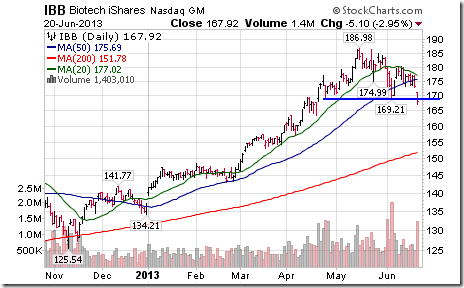
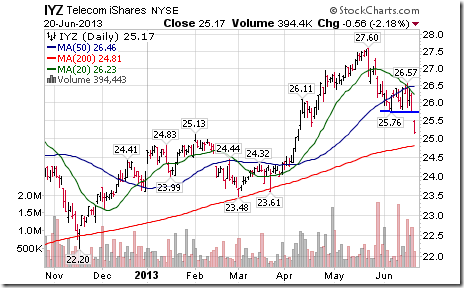
Economic sensitive sub-sectors in the U.S. also recorded significant technical deterioration.
Special Free Services available through www.equityclock.com
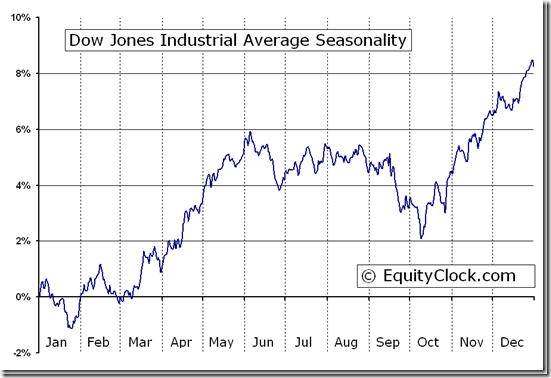
Equityclock.com is offering free access to a data base showing seasonal studies on individual stocks and sectors. The data base holds seasonality studies on over 1000 big and moderate cap securities and indices. Notice that most of the seasonality charts have been updated recently.
To login, simply go to http://www.equityclock.com/charts/
Following is an example:
Dow Jones Industrial Average (^DJI) Seasonal Chart
Disclaimer: Comments and opinions offered in this report at www.timingthemarket.ca are for information only. They should not be considered as advice to purchase or to sell mentioned securities. Data offered in this report is believed to be accurate, but is not guaranteed.
Don and Jon Vialoux are research analysts for Horizons Investment Management Inc. All of the views expressed herein are the personal views of the authors and are not necessarily the views of Horizons Investment Management Inc., although any of the recommendations found herein may be reflected in positions or transactions in the various client portfolios managed by Horizons Investment Management Inc
Horizons Seasonal Rotation ETF HAC June 20th 2013


