Pre-opening Comments for Monday June 17th
U.S. equity index futures were higher this morning. S&P 500 futures were up 13 points in pre-opening trade. Index futures moved higher in anticipation of encouraging comments expected to be released by the FOMC on Wednesday.
Equity markets were virtually unchanged following release of the June Empire Manufacturing Index. Consensus was unchanged versus a decline of 1.4 in May. Actual was a gain to 7.84.
BCE (C$44.16) is expected to open higher after Canaccord upgraded the stock from Hold to Buy. Target is $46. Canaccord also upgraded Rogers Communications (C$RCI.B $45.35) to a Buy.
Red Hat (RHT $46.01) is expected to open lower after Susquehanna downgraded the stock from Positive to Neutral. Target was reduced from $65 to $50.
Comcast added $0.78 to $40.52 after Raymond James upgraded the stock from Outperform to Strong Buy.
Chevron is expected to open lower after Jefferies downgraded the stock from Buy to Hold. Target is $135.
Economic News This Week
The June Empire Manufacturing Index to be released at 8:30 AM EDT on Monday is expected to improve to 0.0 from -1.4 in May.
May Consumer Prices to be released at 8:30 AM EDT on Tuesday is expected to increase 0.2% versus a decline of 0.4% in April. Excluding food and energy, May CPI is expected to increase 0.2% versus a gain of 0.1% in April.
May Housing Starts to be released at 8:30 AM EDT on Tuesday are expected to increase to 950,000 from 853,000 in April.
The FOMC decision on interest rates to be released at 2:00 PM EDT on Wednesday is expected to show no change in the Fed Fund rate.
Weekly Initial Jobless Claims to be released at 8:30 AM EDT on Thursday are expected to increase to 340,000 from 334,000 last week.
May Existing Home Sales to be released at 10:00 AM EDT on Thursday are expected to increase to 5.00 million from 4.97 million in April
The June Philadelphia Fed Manufacturing Index to be released at 10:00 AM EDT on Thursday is expected to improve to -1.0 from -5.2 in May
May Leading Economic Indicators to be released at 10:00 AM EDT on Thursday are expected to increase 0.2% versus a gain of 0.6% in April.
May Canadian Consumer Prices to be released at 8:30 AM EDT on Friday are expected to increase 0.4% versus a 0.2% decline in April.
April Canadian Retail Sales to be released at 8:30 AM EDT on Friday are expected to increase 0.2% versus no change in March.
Earning News This Week
Tuesday: Adobe
Wednesday: FedEx, Jabil Circuit, Micron, Red Hat
Thursday: Kroger
Friday: Carnival, Darden
Mr Vialoux on BNN on Friday
Following are links to the show:
http://watch.bnn.ca/#clip947543
http://watch.bnn.ca/#clip947562
http://watch.bnn.ca/#clip947560
http://watch.bnn.ca/#clip947578
http://watch.bnn.ca/clip947595#clip947595
http://watch.bnn.ca/clip947595#clip947602
http://watch.bnn.ca/clip947595#clip947611
http://watch.bnn.ca/clip947595#clip947609
Equity Trends
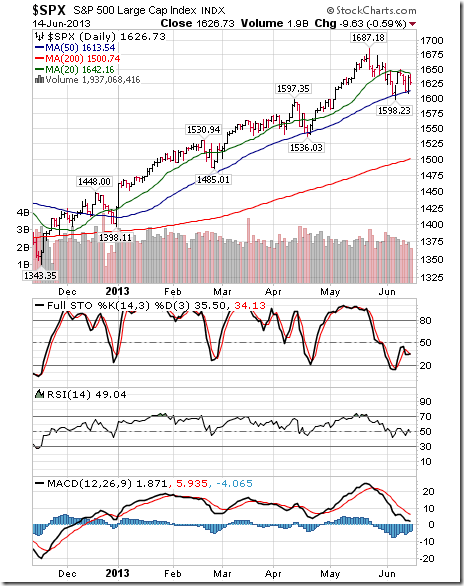
The S&P 500 Index fell 16.65 points (1.01%) last week. Trend remains up. Resistance is at its May 22nd high at 1,687.18. Support is at 1,598.23. The Index remains below its 20 day moving average, but bounced once again from near its 50 day moving average. Short term momentum indicators have declined to neutral levels.
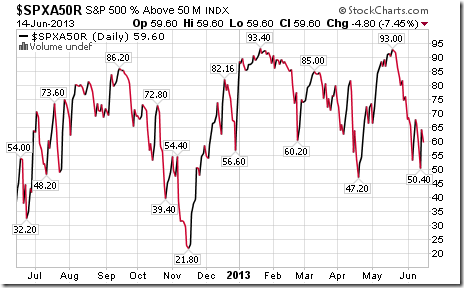
Percent of S&P 500 stocks trading above their 50 day moving average fell last week to 59.60% from 67.80%. Percent remains in a downtrend from an intermediate overbought level.
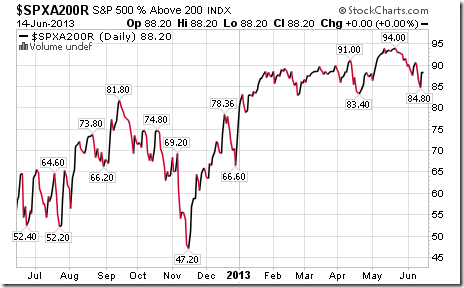
Percent of S&P 500 stock trading above their 200 day moving average slipped last week to 88.20% from 90.60%. Percent remains in a downtrend from an intermediate overbought level.
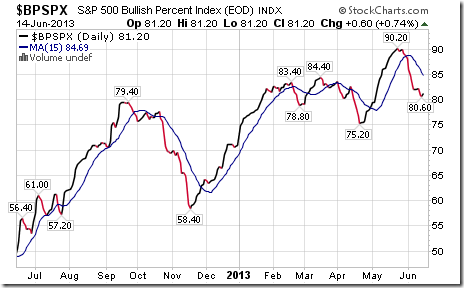
Bullish Percent Index for S&P 500 stocks slipped last week to 81.20% from 82.00% and remained below its 15 day moving average. The Index continues to trend down from an intermediate overbought level.
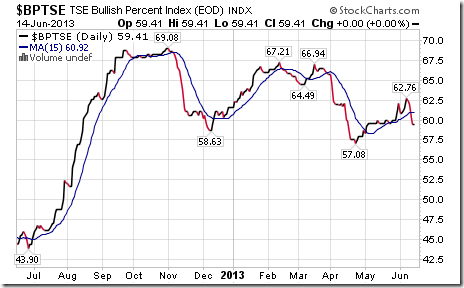
Bullish Percent Index for TSX Composite stocks fell last week to 59.41% from 62.76% and dropped below its 15 day moving average. The Index has resumed an intermediate downtrend.
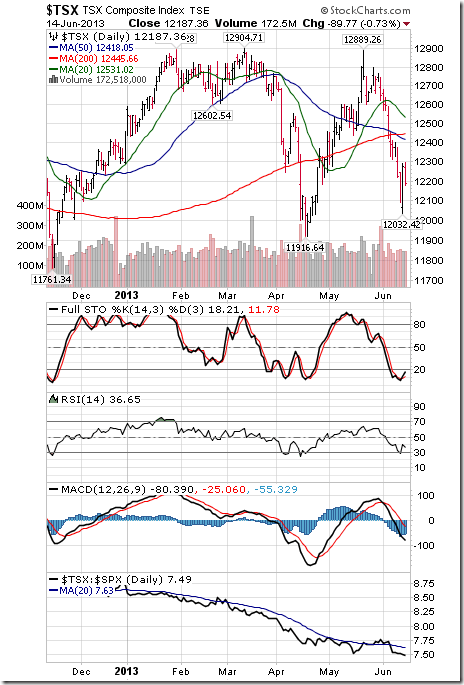
The TSX Composite Index fell 185.94 points (1.50%) last week. Trend remains down. The Index remains below its 20 day moving average and completed a “Death Cross” when its 50 day moving average fell below its 200 day moving average. Tech Talk is not a believer in the Death Cross indicators, but other technical analysts are talking about it. Strength relative to the S&P 500 Index changed from neutral to negative. Technical score based on the above indicators changed from 0.5 to 0.0 out of 3.0. Short term momentum indicators are oversold, but have yet to show signs of bottoming.
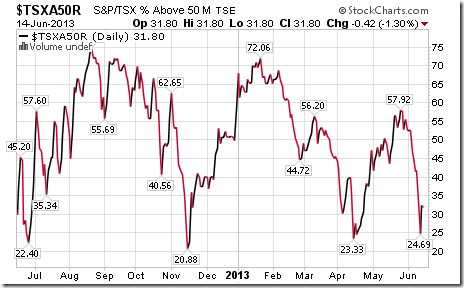
Percent of TSX stocks trading above their 50 day moving average fell last week to 31.80% after briefly reaching a low of 24.69%. Historic data shows that the TSX Composite Index frequently bottoms on a recovery by Percent from below the 25% level.
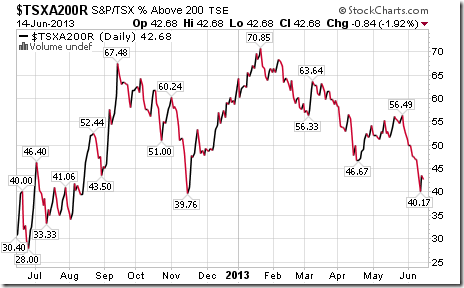
Percent of TSX stocks trading above their 200 day moving average fell last week to 42.68% from 46.86%. Percent continues in an intermediate downtrend.
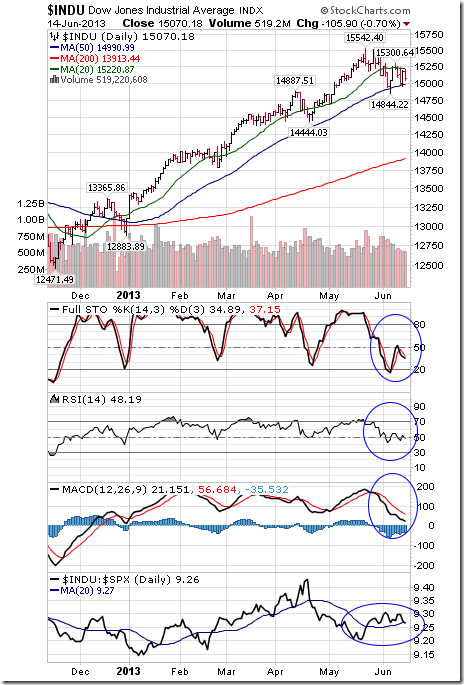
The Dow Jones Industrial Average fell 177.94 points (1.17%) last week. Trend remains up. Resistance is at its May 22nd high at 15,532.40The Average remains below its 20 day moving average and bounced from near its 50 day moving average. Strength relative to the S&P 500 Index changed from positive to neutral. Technical score based on the above indicators slipped to 1.5 from 2.0 out of 3.0. Short term momentum indicators have declined to neutral levels.
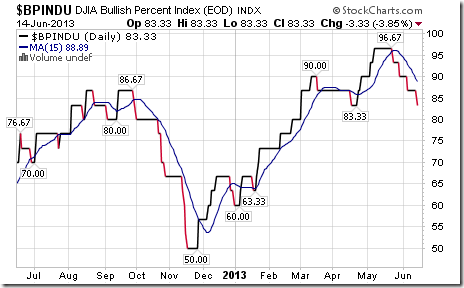
Bullish Percent Index for Dow Jones Industrial Average stocks fell last week to 83.33% from 86.67% and remained below its 15 day moving average. The Index is intermediate overbought and trending down.
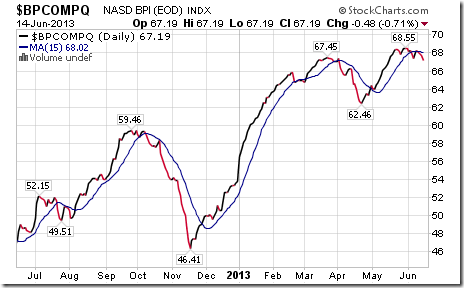
Bullish Percent Index for the NASDAQ Composite Index slipped last week to 67.19% from 68.05% and remained below its 15 day moving average. The Index has rolled over from an intermediate overbought level.
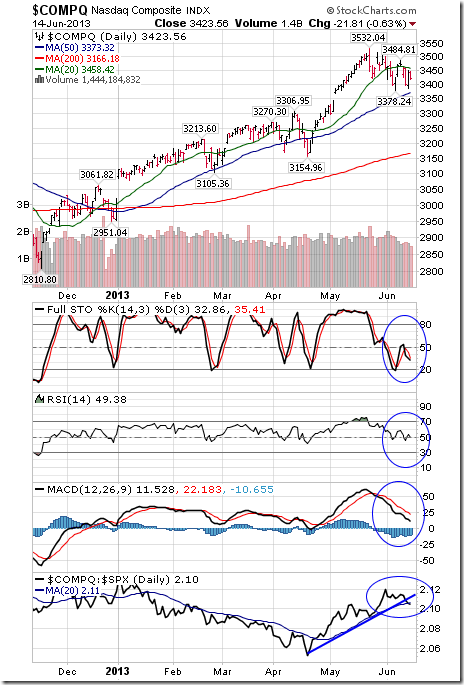
The NASDAQ Composite Index dropped 45.66 points (1.32%) last week. Trend remains down. The Index remains below its 20 day moving average. Strength relative to the S&P 500 Index changed from positive to neutral. Technical score slipped from 2.0 to 1.5 out of 3.0.Short term momentum indicators have declined to neutral levels.
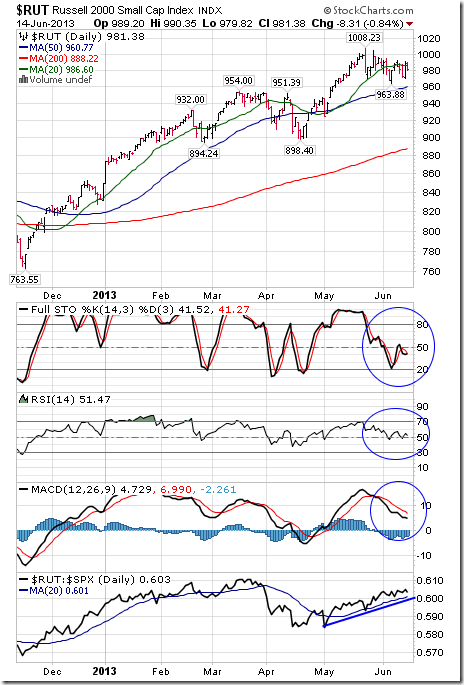
The Russell 2000 Index slipped 6.24 points (0.63%) last week. Trend remains down. Support is at 963.88. The Index remains below its 20 day moving average. Strength relative to the S&P 500 Index changed from neutral to positive. Technical score improved from 1.5 to 2.0. Short term momentum indicators have declined ton neutral levels.
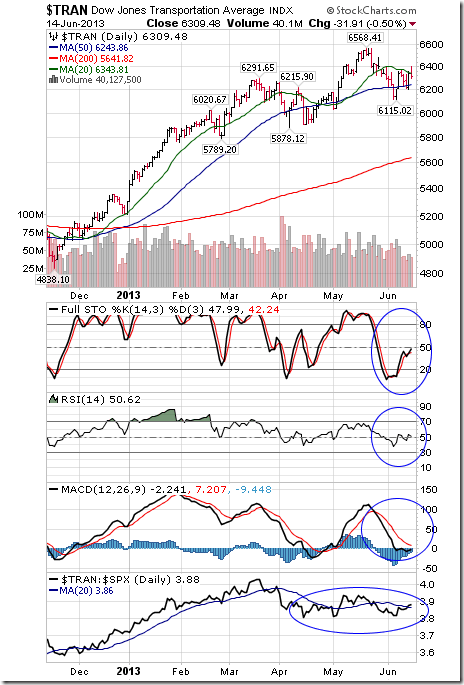
The Dow Jones Transportation Average dropped 34.31 points (0.54%) last week. Trend remains up. Resistance is at 6,568.41 and support is at 6,115.02. The Average remains below its 20 day moving average. Strength relative to the S&P 500 Index changed from negative to neutral. Technical score improved from 1.0 to1.5 out of 3.0. Short term momentum indicators are neutral.
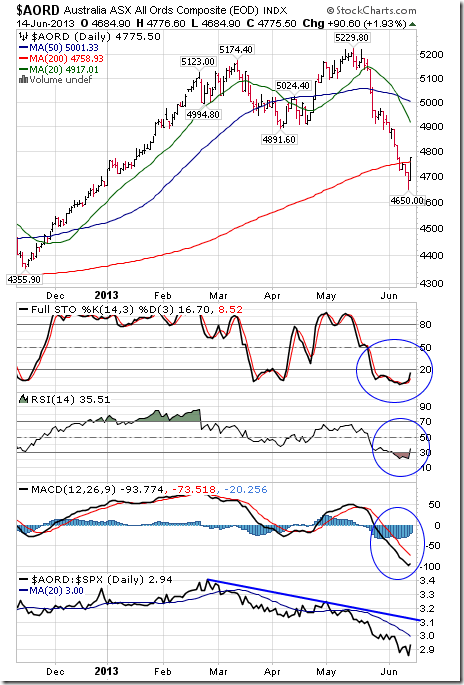
The Australia All Ordinaries Composite Index added 46.20 points (0.98%) last week. Trend remains neutral. The Index remains below its 20 and 50 day moving averages. Strength relative to the S&P 500 Index remains negative. Short term momentum indicators are oversold and showing early signs of bottoming.
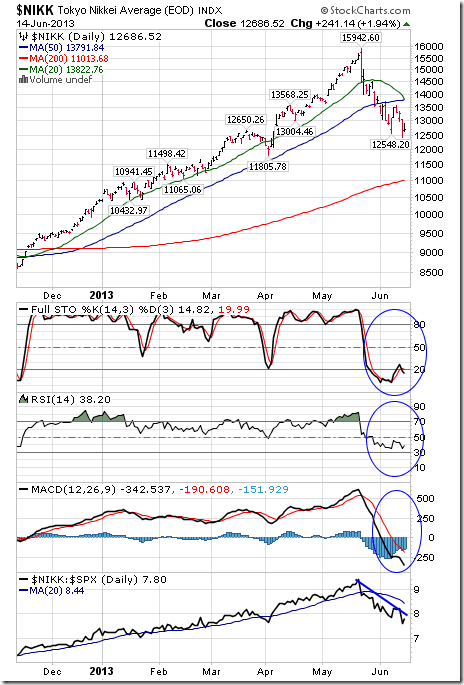
The Nikkei Average dropped another 191.01 points (1.48%) last week. Trend remains neutral. The Average remains below its 20 and 50 day moving averages. Strength relative to the S&P 500 Index remains negative. Technical score remains at 0.5 out of 5.0. Short term momentum indicators are oversold, but have yet to show signs of bottoming.
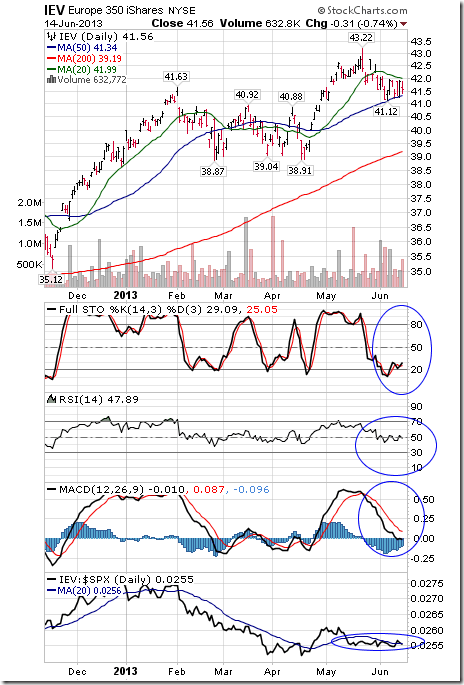
Europe 350 iShares slipped $0.34 (0.81%) last week. Trend remains neutral Support is at $41.12. Units remain below their 20 day moving average. Strength relative to the S&P 500 Index changed from negative to neutral. Technical score improved from 0.5 to 1.0. Short term momentum indicators are trending down.
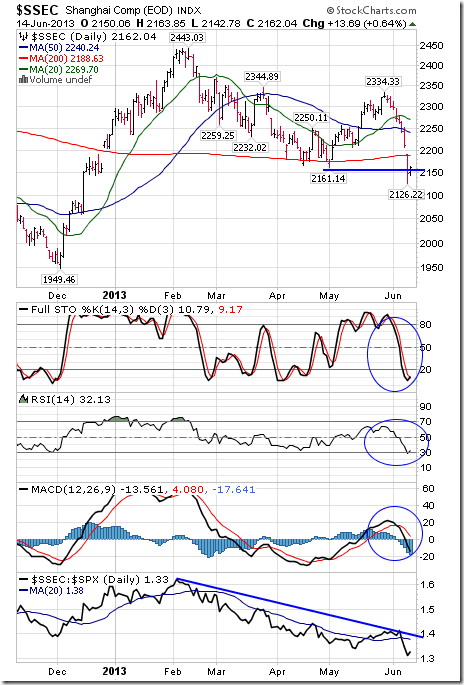
The Shanghai Composite Index dropped 48.86 points (2.21%) last week. Trend changed from neutral to negative on a move below support at 2,161.14. The Index remains below its 20 day and 50 day moving averages and fell below its 200 day moving average. Strength relative to the S&P 500 Index changed from neutral to negative. Technical score fell from 1.0 to 0.0. Short term momentum indicators are trending down.
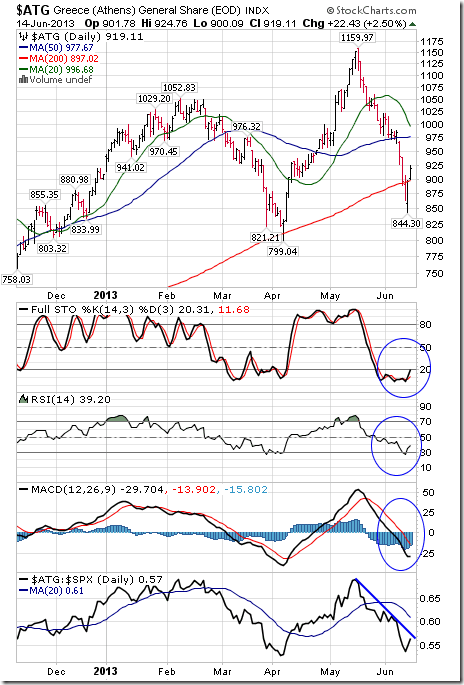
The Athens Index plunged another 66.94 points (6.79%) last week. Trend is down. The Index remains below its 20 and 50 day moving averages. Strength relative to the S&P 500 Index remains negative. Short term momentum indicators are overbought, but have yet to signs of bottoming.
Currencies
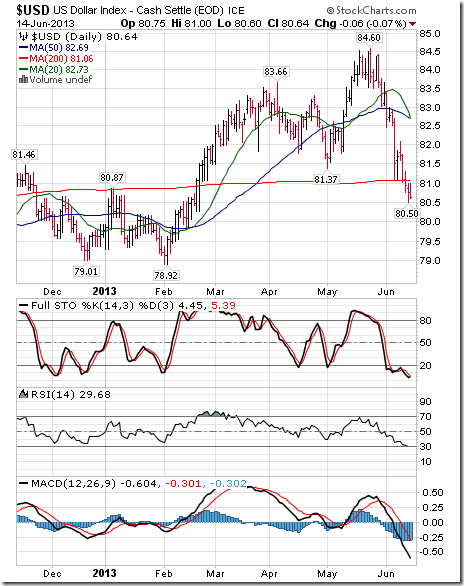
The U.S. Dollar fell another 1.05 (1.29%) last week. Trend remains neutral. The Dollar remains below its 20 and 50 day moving average and fell below its 200 day moving average. Short term momentum indicators are oversold, but have yet to show signs of bottoming.
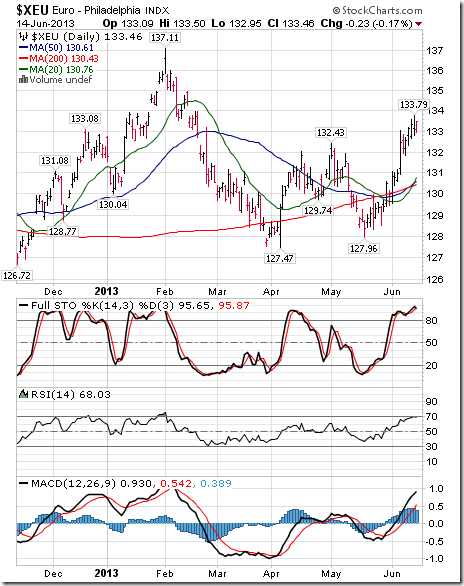
The Euro added another 1.24 (0.94%) last week. The Euro remains above its 20, 50 and 200 day moving average. Short term momentum indicators are overbought, but have yet to show signs of peaking.
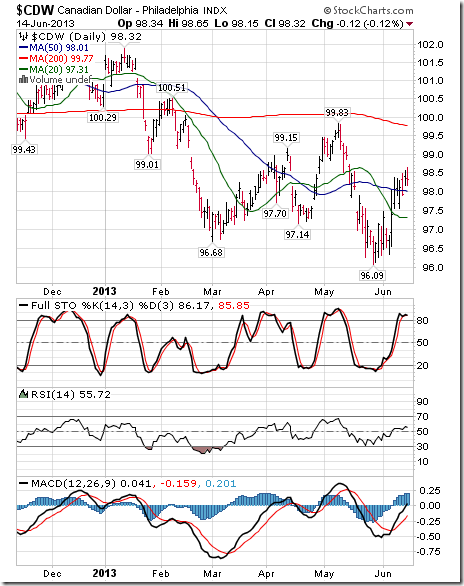
The Canadian Dollar added US 0.21 cents (0.21%) last week. The Canuck Buck remains above its 20 and 50 day moving averages. Short term momentum indicators are trending up.
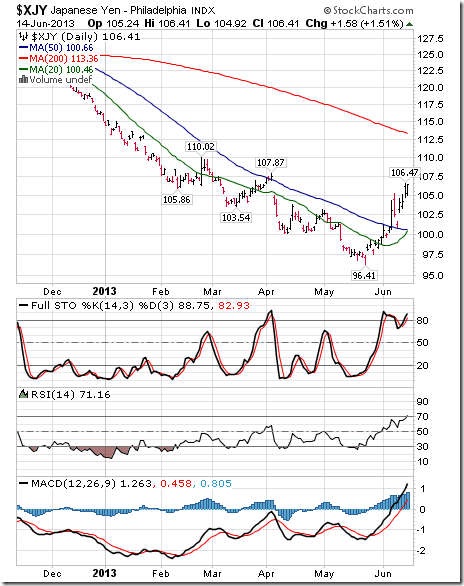
The Japanese Yen gained another 3.85 (3.75%) last week. Trend remains neutral. The Yen remains above its 20 and 50 day moving averages. Short term momentum indicators are overbought, but have yet to show signs of peaking.
Commodities
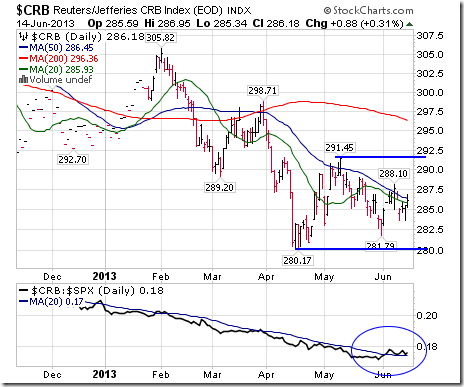
The CRB Index slipped 1.49 points (0.52%) last week. Trend remains down. The Index remained above its 20 and 50 day moving averages. Strength relative to the S&P 500 Index remains neutral. Technical score remains at 1.5
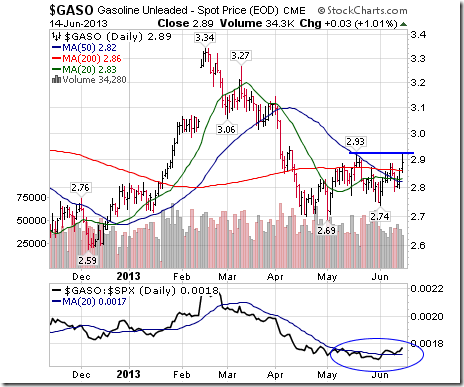
Gasoline gained $0.02 per gallon (0.70%) last week. Trend remains neutral. Resistance at $2.93 is being tested. Gasoline remains above its 20, 50 and 200 day moving averages. Strength relative to the S&P 500 Index remains positive. Technical score remains at 2.5 out of 3.0.
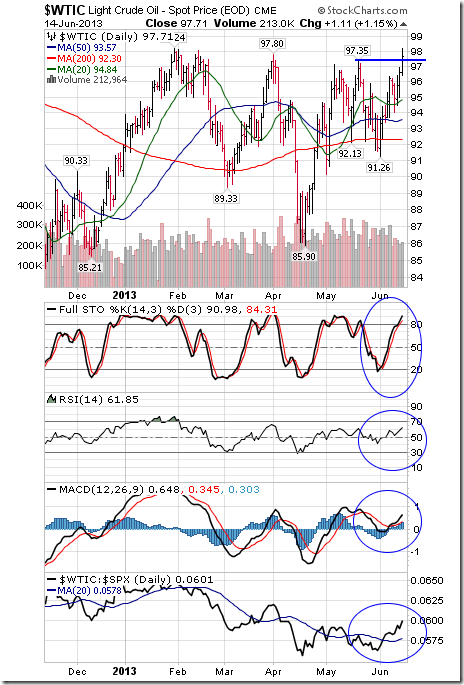
Crude Oil gained another $1.68 (1.75%) last week. Trend changed from neutral to positive on Friday when crude moved above resistance at $97.35 and $97.80. Crude remains above its 20, 50 and 200 day moving averages. Strength relative to the S&P 500 Index remains positive. Technical score improved from 2.5 to 3.0. Short term momentum indicators are trending up.
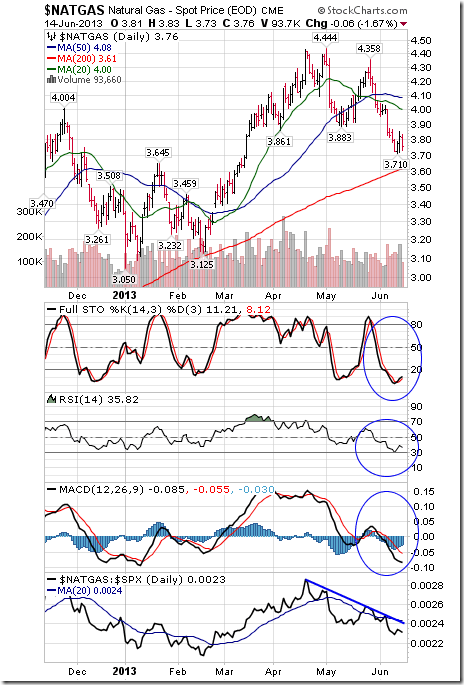
Natural Gas dropped another $0.07 (1.83%) last week. Trend remains negative. Natural Gas remains below its 20 and 50 day moving averages. Strength relative to the S&P 500 Index remains negative. Technical score remains at 0.0 out of 3.0. Short term momentum indicators are oversold, but have yet to show signs of bottoming.
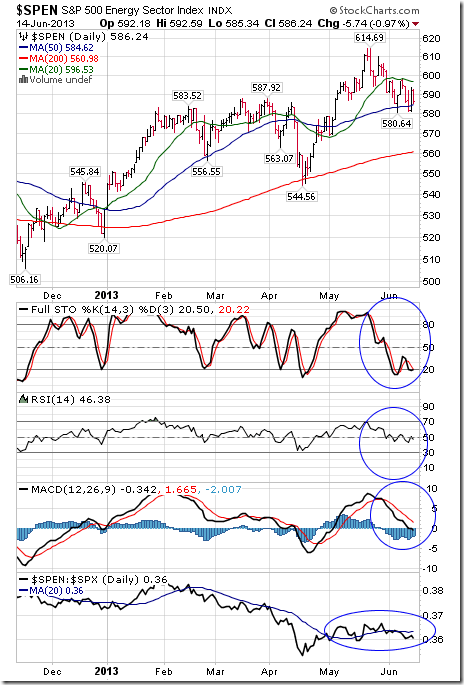
The S&P Energy Index fell 9.98 points (1.67%) last week. Trend remains up. Support is at 580.64. The Index remains below its 20 day moving average. Strength relative to the S&P 500 Index changed from neutral to positive. Technical score slipped to 1.0 to 1.5. Short term momentum indicators have declined to neutral levels.
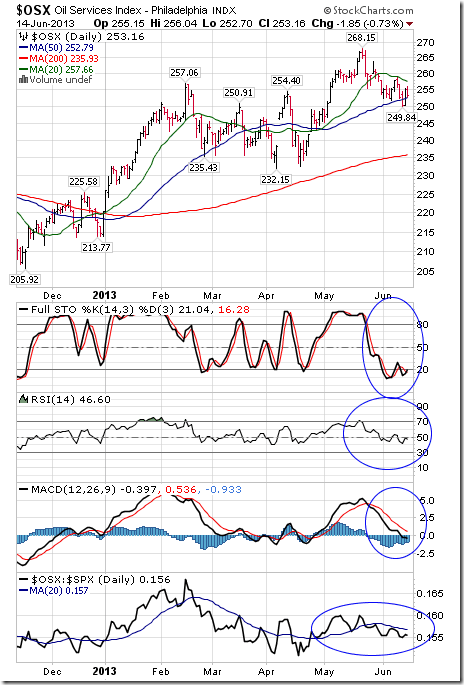
The Philadelphia Oil Services Index fell 4.69 points (1.82%) last week. Trend remains neutral. The Index remains below its 20 day moving average. Strength relative to the S&P 500 Index changed back to negative from neutral. Technical score slipped from 1.0 to 0.5. Short term momentum indicators continue to trend down.
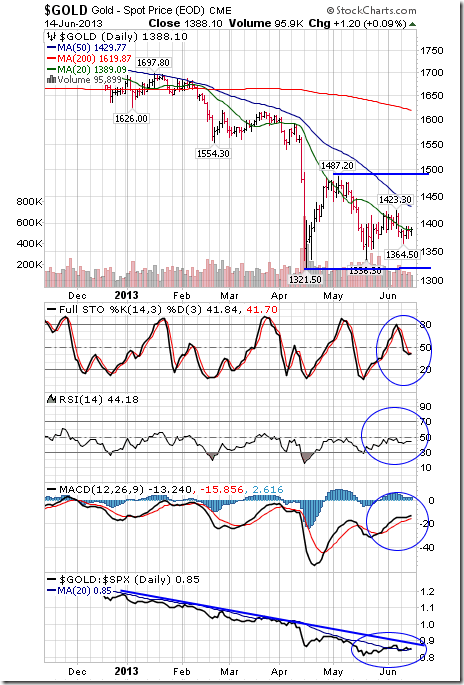
Gold gained $5.10 per ounce (0.37%) last week. Trend remains down. Gold remains below its 20, 50 and 200 day moving averages. Strength relative to the S&P 500 Index remains negative, but showing signs of change. Technical score improved from 0.0 to 0.5. Short term momentum indicators are neutral
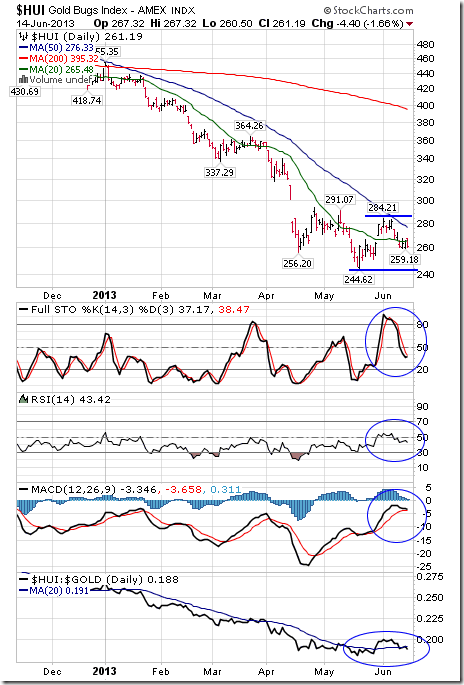
The AMEX Gold Bug Index dropped 4.69 points (1.82%) last week. Trend remains down. Resistance is at 284.21. The Index moved below its 20 day moving average. Strength relative to the S&P 500 Index changed from positive to neutral. Technical score fell from 2.0 to 0.5. Strength relative to gold remains negative. Short term momentum indicators are neutral.
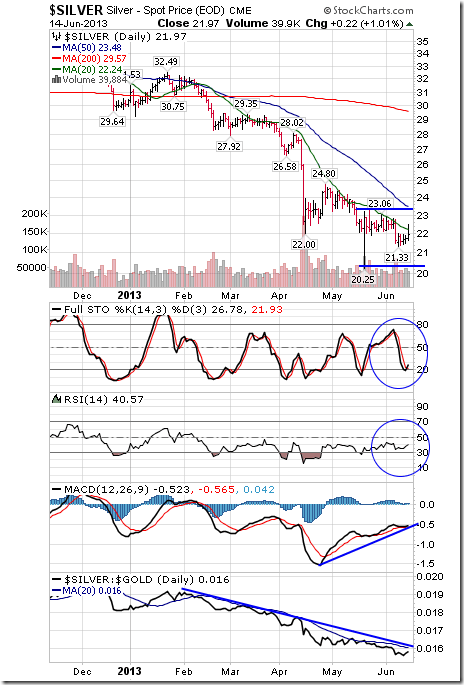
Silver gained $0.23 (1.06%) last week. Trend remains down. Silver remains below its 20, 50 and 200 day moving averages. Strength relative to gold remains negative, but has improved from negative to positive relative to the S&P 500 Index. Technical score improved from 0.0 to 1.0. Short term momentum indicators are oversold and trying to bottom.
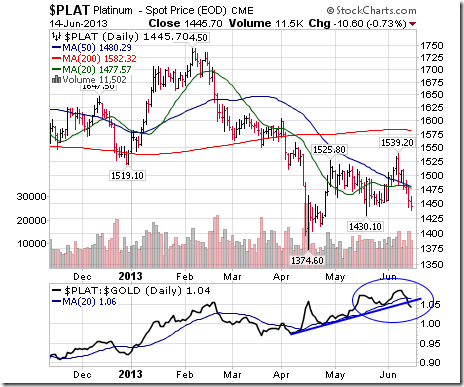
Platinum fell $56.90 (3.79%) last week. Trend remains up. Platinum moved below its 20 and 50 day moving averages. Strength relative to gold and the S&P 500 changed from positive to negative. Technical score changed from 3.0 to 1.0.
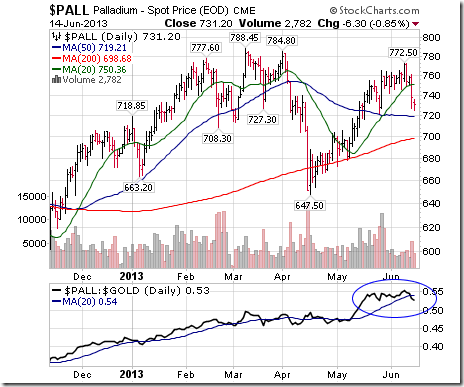
Palladium dropped $30.00 per ounce (3.94%) last week. Trend changed from up to neutral. Palladium fell below its 20 day moving average. Strength relative to gold dropped to neutral
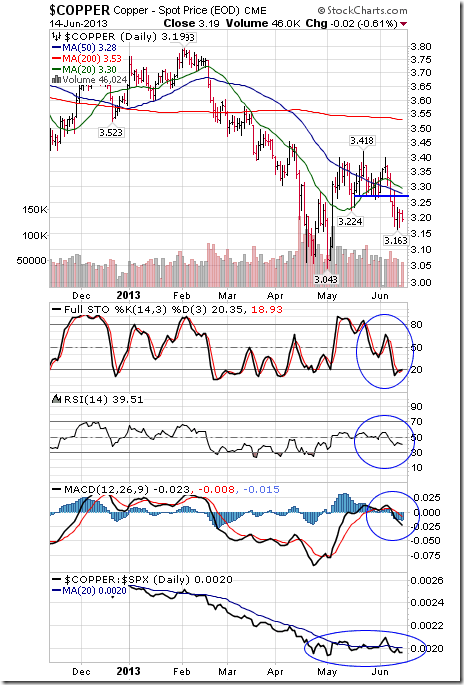
Copper fell another $0.08 per lb. (2.45%) last week. Trend changed from up to neutral. Copper remains below its 20 and 50 day moving averages. Strength relative to the S&P 500 Index changed from neutral to negative. Technical score changed from 1.5 to 0.5. Short term momentum indicators are trending down.
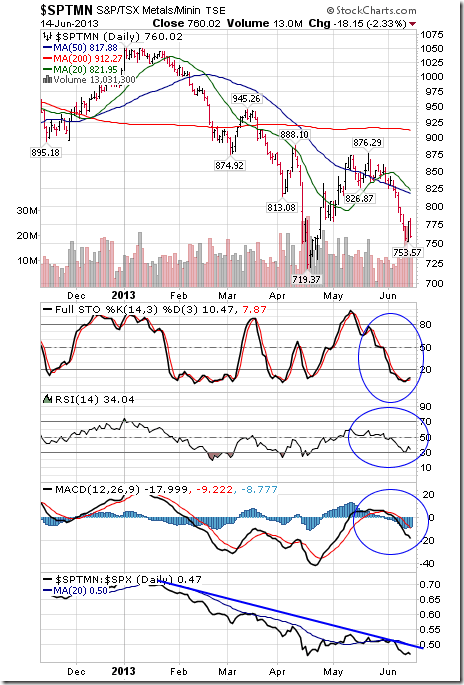
The TSX Metals and Minerals Index fell another 35.21 points (4.43%) last week. Trend remains down. The Index remains below its 20, 50 and 200 day moving averages. Strength relative to the S&P 500 Index remains negative. Technical score remained at 0.0 out of 3.0. Short term momentum indicators are oversold, but have yet to show signs of bottoming.
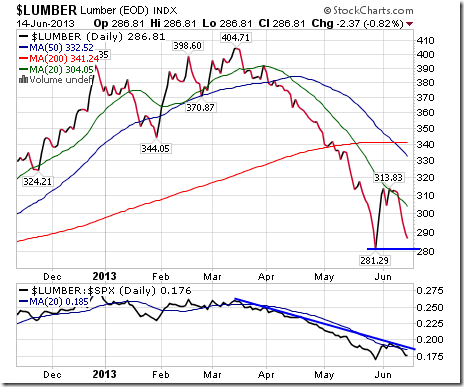
Lumber dropped $26.02 (8.32%) last week. Trend remains down. Lumber returned to below its 20 day moving average. Strength relative to the S&P 500 Index returned to negative from neutral. Technical score returned to 0.0 from 1.0 out of 3.0.
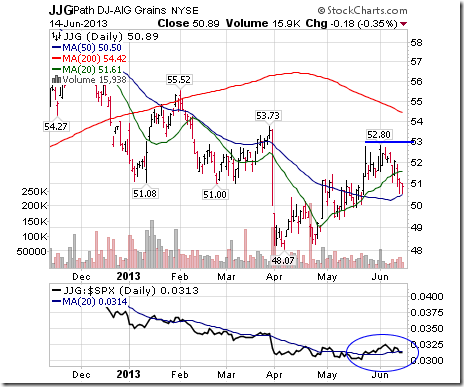
The Grain ETN fell $1.31 (2.51%) last week. Trend remains up. Units fell below their 20 day moving average. Strength relative to the S&P 500 Index changed from positive to neutral.
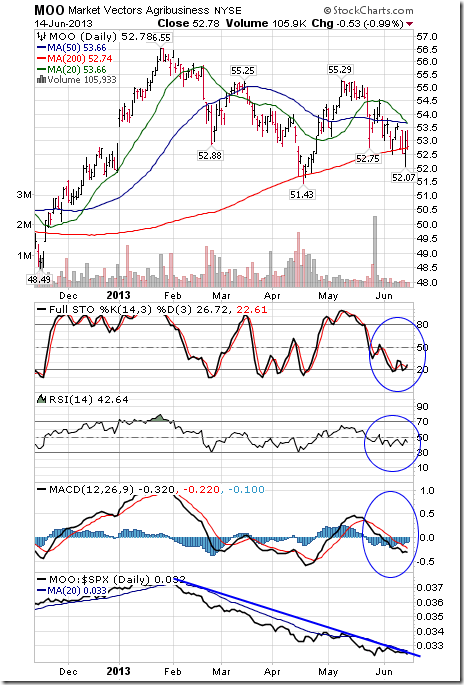
The Agriculture ETF lost $0.67 (1.25%) last week. Trend remains negative. Units remain below their 20 and 50 day moving averages. Strength relative to the S&P 500 Index remains negative. Technical score remains at 0.0 out of 3.0. Short term momentum indicators are trending down.
Interest Rates
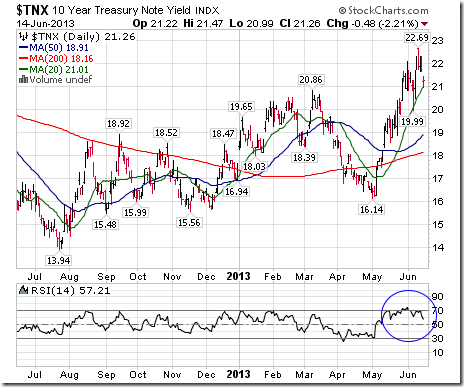
The yield on 10 year Treasuries slipped 3.5 basis points (1.62%) last week. Yield remains above its 230, 50 and 200 day moving averages. Short term momentum indicators are overbought and showing early signs of rolling over.
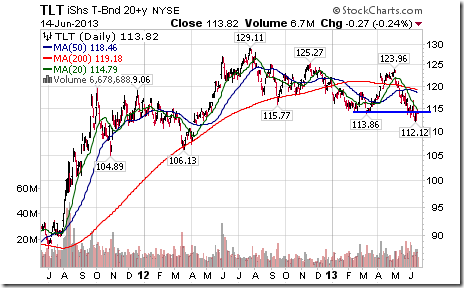
Conversely, the long term Treasury ETF added $0.66 (0.58%) last week. Trend remains down. Units remain below their 20, 50 and 200 day moving averages.
Other Issues
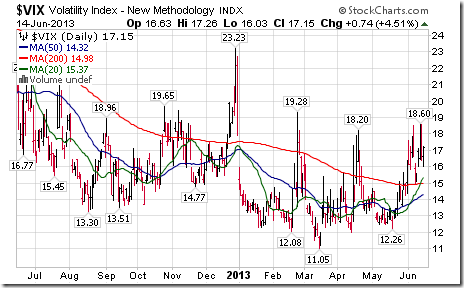
The VIX Index spiked 2.01 (13.28%) last week. It remains above its 20, 50 and 200 day moving averages.
Economic focus this week is on the FOMC meeting announcement on Wednesday. The Federal Reserve will try to allay “tapering” fears. Other economic data is expected to show a stall in economic growth in the May/early June.
Earnings news is expected to have limited impact on equity markets. Focus will be on FedEx on Wednesday, a benchmark for world economic growth. Major companies have just entered into their “quiet period” prior to release of second quarter results. Corporate news becomes less frequent unless second quarter results are a clear miss (one way or the other). Earnings confession season has just started.
The G8 meeting early this week is a major “photo-op”, but is unlikely to have a significant impact on equity markets.
Extreme fluctuations in currencies continue and are a major source for higher than average inter-day volatility in equity markets.
Seasonal performance by North American equity indices during the second half of June is negative. June is the second weakest month of the year for the Dow Jones Industrial Average and TSX Composite Index and third weakest month of the year for the S&P 500 Index.
Short and medium term technical indicators for broadly based equity indices and economic sensitive sectors continue to trend down. Key levels to watch are the 50 day moving averages by broadly based U.S. equity indices. So far, their 50 day moving averages have proven to be confirmed support. A break below these levels on a close will trigger significant technical selling. The 50 day moving average for the S&P 500 Index is 1,614. The 50 day moving average
for the Dow Industrials is 14,991.
International events are starting to have an impact on selected markets, most notably the energy market. The breakout by crude oil on Friday triggered partially by growing tensions in the Middle East is positive for the energy sector, but negative for other economic sensitive sectors.
The Bottom Line
The intermediate corrective phase in North American equity markets remains intact. Short term strength provides an opportunity to reduce equity exposure, particularly in sectors that have a history of moving lower during a summer corrective phase. These sectors included industrials, consumer discretionary, materials and financials.
Selected sectors are setting up for seasonal trades this summer including fertilizers, energy and gold. They already are showing signs of outperformance relative to the S&P 500 Index and the TSX Composite Index. Stay tuned for special sector opportunities as the summer progresses.
The latest weekly update on ETFs in Canada is available at
Special Free Services available through www.equityclock.com
Equityclock.com is offering free access to a data base showing seasonal studies on individual stocks and sectors. The data base holds seasonality studies on over 1000 big and moderate cap securities and indices. Notice that most of the seasonality charts have been updated recently.
To login, simply go to http://www.equityclock.com/charts/
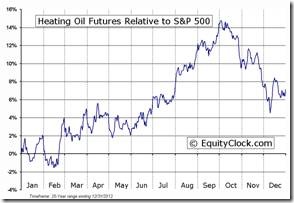
Following is an example:
FUTURE_HO1 Relative to the S&P 500
Disclaimer: Comments and opinions offered in this report at www.timingthemarket.ca are for information only. They should not be considered as advice to purchase or to sell mentioned securities. Data offered in this report is believed to be accurate, but is not guaranteed.
Don and Jon Vialoux are research analysts for Horizons Investment Management Inc. All of the views expressed herein are the personal views of the authors and are not necessarily the views of Horizons Investment Management Inc., although any of the recommendations found herein may be reflected in positions or transactions in the various client portfolios managed by Horizons Investment Management Inc
Horizons Seasonal Rotation ETF HAC June 14th 2013


