The Game of Risk
by Jeffrey Saut, Chief Investment Strategist, Raymond James
June 17, 2013
“To be sure, there is no exact definition of what ‘calling’ a market top or bottom involves. In the case of the March 2009 bear market bottom, for example, does ‘calling’ it mean the adviser's portfolio needs to have moved from being all cash to 100% invested in stocks on the exact day of the bottom? If my analysis had relied on a definition as demanding as this, then it wouldn't be surprising that no timers called recent market turning points. But my analysis actually relied on a far more relaxed definition: Instead of moving 100% from cash to stocks in the case of a bottom, or 100% the other way in the case of a top, I allowed exposure changes of just ten percentage points to qualify. Furthermore, rather than requiring the change in exposure to occur on the exact day of the market's top or bottom, I looked at a month-long trading window that began before the market's juncture and extending a couple of weeks thereafter. Even with these relaxed criteria, however, none of the market timers that the Hulbert Financial Digest has tracked over the last decade were able to call the market tops and bottoms since March 2000. These results add up to perhaps the most important investment lesson of all that: predicting turns in the market is incredibly difficult to do consistently well.”
... Mark Hulbert, MarketWatch (3/10/10)
The above excerpt was penned by Mark Hulbert in an article titled “Fools R Us.” Appropriately, that article ran in a MarketWatch column on the 10-year anniversary of the NASDAQ Composite’s peak of March 10, 2000. Ten years ago the COMP was changing hands around 5132. It is now trading at 3423 for a 13-year loss of some 33.3%. Meanwhile, over that same timeframe, the earnings of the S&P 500 are up 83%, nominal GDP is better by some 57.6%, and interest rates are substantially below where they were back then. If you are a college professor such statistics do not “foot” with your teachings because professors tend to believe stock returns are all about earnings and interest rates. I concur, but would add the caveat, “That is if you live long enough.” As money manager Greg Evans, eponymous captain of Millstone Evans in Boulder Colorado, writes:
“Hey Jeff, I enjoyed your missive on Mr. Market. I use that Warren Buffet allegory quite a bit with clients. One interesting statistic on Berkshire is that its stock price was $38 in 1968 and 8 years later, after trading higher and lower, ended up (again) at $38. Most clients would look at that (performance) and say – it hasn't done anything for 8 years so I am going to sell. But an astute investor, looking at the underlying growth in book value, would see an average annual growth rate of 14.6% over those 8 years and conclude they should buy more. As to your point that over the long-term stock prices are ultimately determined by their book value, earnings and cash flows, I have often run numbers on stocks over a 25-year time frame to show to clients. For example, Coca-Cola's stock price in 1983 was $5.10 (midpoint); and, Coke earned $0.30 per share that year. The stock price today is ~$40, and they earned $1.97 last year. That’s about a 15% annualized growth rate on the stock price; and, a ~15% growth rate on earnings – QED.”
Surprisingly, however, if an investor bought Coke shares at their peak price in 1972, over the next 12 years the company compounded earnings at nearly double-digit rates (with only four down quarters), yet said shareholders actually lost money. The reason was “Mr. Market” was unwilling to capitalize that improvement in earnings anywhere near the P/E multiple of 1972. Regrettably, “Mr. Market” is indeed manic depressive, which is why the stock market is truly fear, hope and greed only loosely connected to the business cycle. And that, ladies and gentlemen, is why the successful investor needs to learn how to manage risk. As Benjamin Graham wrote, “The essence of investment management is the management of RISKS, not the management of RETURNS. Well-managed portfolios start with this precept.”
Clearly, Warren Buffet understands this “management of risk” concept for he too has learned when to “play hard” and when not to “play.” Decidedly, his insight to hoard cash, and shun internet stocks, in the late 1990s was brilliant, yet it was greeted with catcalls that “the old man has lost his touch and just doesn’t understand the Internet age.” However, investors benefitted handsomely if they heeded his advice. Enter the aforementioned quote from Mark Hulbert espousing the old market axiom, “It’s TIME in the market, not TIMING the market.” Typically such comments are accompanied with the verbiage, “If you missed the 10 best stock market sessions of the year it kills your returns.” To be sure, over the 25-year period ending on 12/31/2011 the buy and hold investor saw returns of 6.81% per year. But, if you missed the 10 best sessions your annualized return falls to 3.67%. Miss the 20 best and you experienced only a 1.65% yearly gain, and missing the 40 best yields a negative 1.62% return. However, miss the 10 worst days and a prescient investor realized a 10.89% per annum gain, while missing the 40 worst shows annualized returns leaping to a 17.74% – according to a study from Hepburn Capital Management – thus proving the management of “risks” is more important than the management of “returns” (see chart on page 3).
That said, while I too don’t believe anyone can consistently “time” the stock market, I do believe in Dow Theory. Dow Theory is like a roadmap for the “primary trend” of the stock market. Recall, Dow Theory gave you a “sell signal” in September 1999 (albeit three quarters too soon), a “buy signal” in June 2003 (a few months too late), and again a “sell signal” in November 2007 (note, it is not Jeff Saut “calling” the stock market, but Dow Theory). More importantly, the Dow Theory “buy signal” of earlier this year remains in force. Nevertheless, I continue to think we are in a short/intermediate “topping” process. The timing models that have worked so well year to date targeted June 11/12th as the days that a feint to the downside would start. While I had thought the convening of the German Constitutional Court would be the causa proxima, it turned out to be Japan and its statement that it would not increase the monetary stimulus operations. Subsequently, in Friday morning’s verbal strategy comments, I said:
“I think we are going to limp around and then try for the reaction high of 1687. If we don’t make a higher high on that attempt, and turn down from there, then the mid-July swoon I have been targeting will arrive prematurely. However, if we do make a higher high it probably means we are still going up to make a new high into the first or second week of July and then start the swoon. Indeed, I have mixed signals into the end of this week (meaning last week), as well as mixed signals into the beginning of next week (meaning this week). So, it would not surprise me to see the upside action fizzle today (last Friday) and have the market limp around with attempts to sell off into early next week. However, there are much more positive timing point signals coming next week (aka, this week), so my hunch is that the SPX limps for a few sessions and then starts to push higher.”
And while Friday’s Fade (-106 points) wasn’t much of a “limp,” Thursday’s upside action surely fizzled.
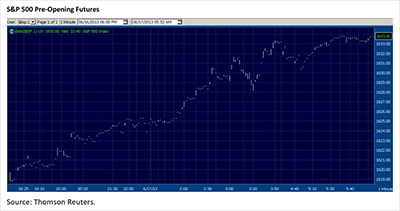
The call for this week: Nassim Taleb (trader extraordinaire) has 10 rules. Rule number 8 reads: “Always protect the downside. As pointed out ad nauseum, Black Swans do occur. No matter how much you test, there will be a ‘this time is different’ moment forcing your bank account into oblivion. No matter how confident, always protect the downside.” I agree with Taleb’s comments and therefore always try to “look” down before looking up in an attempt to manage the risk. As for the here and now, as I said on Friday, “It would not surprise me to see the upside action fizzle today (last Friday) and have the market limp around with attempts to sell off into early next week. However, there are much more positive timing point signals coming next week (aka, this week), so my hunch is that the SPX limps for a few sessions and then starts to push higher.” And this morning “higher” is the watchword as last week’s “taper tantrum” is fading on rumors of a softer Fed at this week’s meeting, leaving the preopening S&P 500 futures up about 12 points.
Copyright © Raymond James


