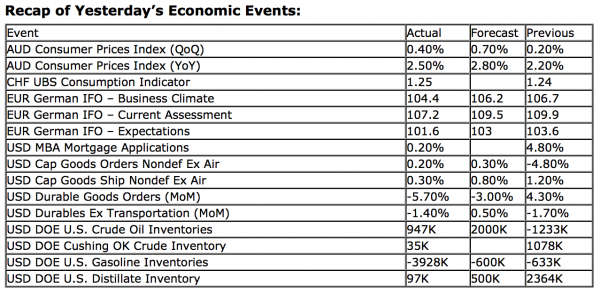
Upcoming US Events for Today:
- Weekly Jobless Claims will be released at 8:30am. The market expects Initial Claims to show 350K versus 352K previous.
- Kansas City Fed Manufacturing Index for April will be released at 11:00am. The market expects –1 versus –5 previous.
Upcoming International Events for Today:
- Great Britain GDP for the First Quarter will be released at 4:30am EST. The market expects a year-over-year increase of 0.3% versus an increase of 0.2% previous.
- Japan Manufacturing PMI for April will be released at 7:15pm EST.
- Japan Consumer Price Index for March will be released at 7:30pm EST. Excluding Food, the market expects a year-over-year decline of 0.4% versus a decline of 0.3% previous.
The Markets
Equity markets in the US ended around the flatline on Wednesday following a tug-and-pull session as investors reacted to earnings from Apple, AT&T, Procter & Gamble, Boeing, and Ford. Investors remained cautious following a report on Durable Goods Orders for the month of March, which declined much more than expected. The 5.7% decline on a month-over-month basis was over twice of the consensus estimate, which called for a decline of 2.8%. Economic misses have been on the rise, encompassing the vast majority of economic reports over recent weeks, the result of which is clearly becoming evident in the Citigroup Economic Surprise Index. The Economic Surprise Index, which measures analyst estimates against actual results, has been trending lower from a March peak, suggesting analyst expectations are too high. This fact can also be seen in the number of companies that have reported sales above estimates, currently at a mere 44.1% based on results released for the first quarter, thus far. The current quarterly revenue beat rate is the third lowest in over 10 years, beaten only by the fourth quarter of 2008 and the first quarter of 2009, just as the recession was beginning. Should actual data, whether it relate to the broad economy or to earnings, fail to catch up to expectations, a correction in forecasts may be in order, the result of which would likely lead to a correction of stock prices as well.
Chart Courtesy of BespokeInvest.com
The stock leaderboard was dominated by Material and Energy stocks on Wednesday as metal and energy commodities rebounded from recent oversold levels. The price of oil jumped by over 2%, retracing back to its 200-day moving average, while Gold gained over 1%, struggling to claw away at the significant losses recorded over the last few weeks. Energy and metal commodities remain in a negative trend, characterized by a series of lower-highs and lower-lows. A number of commodities enter into a period of seasonal weakness around this time of year, ranging well into the summer months.
Despite the rebound in beaten down cyclical sectors over recent days, the trend remains negative, similar to metal and energy commodities. The Morgan Stanley Cyclicals Index has retraced its way back to a declining 20-day moving average. Lower-highs and lower-lows remain evident, based on activity dating back to the peak in mid-March. The market has been showing signs of risk aversion for a number of months, allowing defensive sectors such as Consumer Staples, Health Care, and Utilities to benefit, a scenario that is not seasonally typical until the summer months. The defensive sectors have supported the market, mitigating the effects of a significantly underperforming technology sector and lack-luster performance of energy and material stocks. However, cracks in the defensives stocks, which are currently holding around all-time highs, are starting to emerge. Consumer Staples and Health Care both showed declines of over 1.5% on Wednesday, weighed down by disappointing earnings from Procter & Gambler and Amgen. Both the Consumer Staples ETF (XLP) and Health Care ETF (XLV) remain firmly above 20-day moving averages, a break of which could strip away the last remaining sectors to rely upon for a positive trend within broad equity benchmarks, such as the S&P 500. Negative momentum divergences are starting to become apparent on the charts of XLP and XLV.
Seasonal chart of companies reporting earnings today:
Sentiment on Wednesday, as gauged by the put-call ratio, ended bullish at 0.79.
Chart Courtesy of StockCharts.com
Chart Courtesy of StockCharts.com
Horizons Seasonal Rotation ETF (TSX:HAC)
- Closing Market Value: $13.39 (down 0.15%)
- Closing NAV/Unit: $13.40 (down 0.01%)
Performance*
| 2013 Year-to-Date | Since Inception (Nov 19, 2009) | |
| HAC.TO | 5.35% | 34.0% |
* performance calculated on Closing NAV/Unit as provided by custodian
Click Here to learn more about the proprietary, seasonal rotation investment strategy developed by research analysts Don Vialoux, Brooke Thackray, and Jon Vialoux.


