In this week's version of the SIA Equity Leaders Weekly we are going to re-look at the S&P 500 Index and the outlook going forward for the broader U.S. Equity Asset Class. We are also going to update the CBOE 30-Year Interest Rate outlook which has seen some volatility since our last review.
S&P 500 Index (SPX.I)
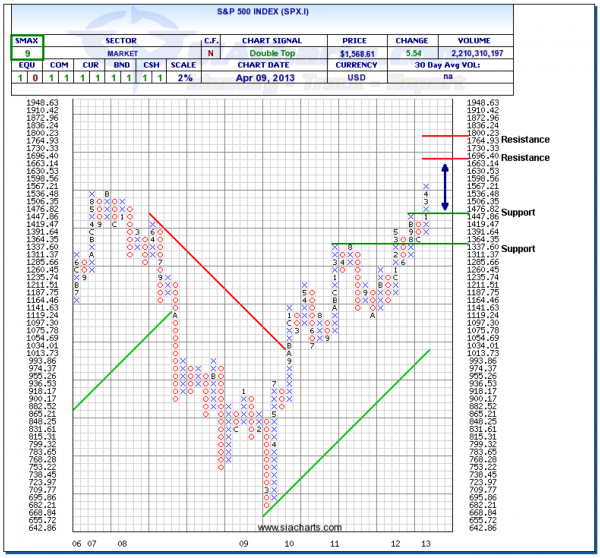
If you have been reading the SIA Equity Leaders Weekly on a regular basis, you have seen the continued commentary about the S&P 500 Composite Index's positive progression for the past 18 months. In this update we now see a breakout to new all-time highs above the 1567.21 resistance level. With this move, resistance above can now be found at 1696.40 and at the 1800 level. SPX.I continues to be in a column of X's on a 2% scale as the long-term outlook still looks positive as U.S. Equity is still the top-ranked asset class in the SIA Asset Allocation model.
To the downside, support can be found at 1447.86 and at the 1337.60 level. An SMAX score of 9 out of 10 still shows positive near-term strength.
Click on Image to Enlarge
CBOE Interest Rate 30 -YR (TYX.I)
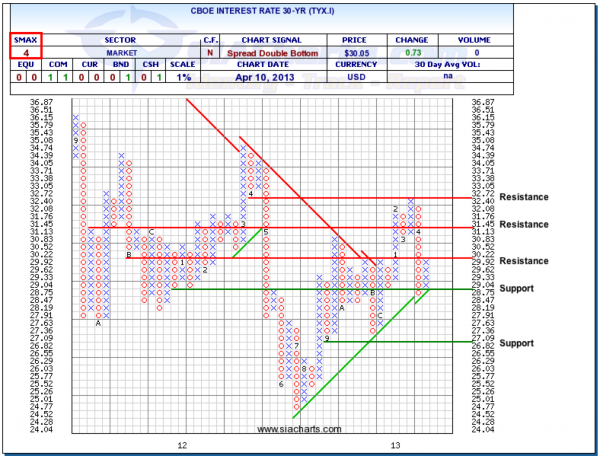
The CBOE 30-Year Interest Rate saw its first significant reversal since November of 2012 this week. Resistance at the 3.272% level held and the subsequent reversal down took out support at 2.992% on its way to secondary support above its uptrend line which managed to hold. This quick drop remains in the context of an uptrend for now but should be monitored in case the 2.875% level is taken out.
The long end of the curve yield remains material to investors of fixed income as a return to an upward movement will put dramatic pressure on the long bonds that have rewarded investors for so long. Near term the pressure appears to be off but we will monitor closely over the coming weeks to see if the short term weakness continues.
Click on Image to Enlarge
Copyright © SIACharts.com


