by Don Vialoux, TechTalk
Comments for Friday April 5th
U.S. equity index futures are lower this morning. S&P 500 futures are down 16 points in pre-opening trade.
Weakness in index futures escalated following release of the jobs report at 8:30 PM EST. Consensus for March Non-farm payrolls was a decline of 190,000 versus a revised 268,000 in February. Actual was 88,000. Consensus for the March Unemployment Rate was unchanged at 7.7%. Actual was a decline to 7.6%. The U.S. Dollar fell sharply following release of the news.
Slightly offsetting was a better than expected trade report. Consensus for the U.S. February trade deficit was $44.6 billion. Actual was $43.0 billion
The employment report in Canada fared worse than the U.S. report. Consensus for March employment was an increase of 6,500. Actual was a loss of 54,500. Consensus for the March Unemployment Rate was unchanged at 7.0%. Actual was an increase to 7.2%.
Canada’s Trade Balance report did not help. Consensus for Canada’s February Merchandise Trade Balance was break even. Actual was a $1.02 billion deficit. The Canadian Dollar weakened on the news.
JP Morgan fell $0.59 to $46.90 despite an upgrade by Evercore from Equal Weight to Overweight. Target was raised from $48 to $55.
Celgene added $0.75 to $116.70 after Deutsche Bank upgraded the stock from Hold to Buy.
F5 Networks plunged $15.92 to $74.50 after lowering fiscal second quarter guidance. Also the stock was downgraded by several U.S. investment dealers.
McDonald’s slipped $0.95 to $99.68 despite an initiated Overweight rating by Stephens. Target is $120.
UBS initiated coverage on the U.S. health care support sector. Cigna, Aetna and UnitedHealth were given a Buy rating.
FBR Capital initiated coverage on the Mining sector. Freeport McMoran Copper and Gold was initiated at Outperform. Southern Copper and Teck Resources were initiated with a Market Perform rating.
Tech Talk’s ETF Column
(Published yesterday at www.globeandmail.com )
Headline reads, “The Sell in May and Go Away strategy is baloney…. But this year”?
Following is a link:
Editor’s Note: The above comment was written over the weekend, but continues to make sense particularly following technical action by U.S. and Canadian markets during the past four trading days.
Keith Richards’ Blog
Seasonal patterns for the markets suggest selling in late April or early May, if you follow the “best six months” strategy. This year, I aggressively sold equities earlier than normal by raising over 40% cash last week. So far, that decision seems justified. Right now I’m creating a shopping list of stocks and sectors that I will consider in the event of a pullback. Learn more about why I sold, and what I’m watching at www.smartbounce.ca
By the way–I’m on BNN’s MarketCall tomorrow (Friday April 5th) at 6:00pm. Tune in to get the technical scoop on the markets.
Updates on Sector Seasonal Trades
Seasonal trades optimally have a technical score of 3 based on (1) uptrend, (2) trading above their 20 day moving average and (3) outperforming the market (S&P 500 for U.S. holdings, TSX for Canadian holdings). Scores moving lower than 3 are warnings signs. A score of 0-0.5 is a sell signal. The following seasonal trades have a technical score of 1.0 or higher and are in their period of seasonal strength. Their retention is recommended.
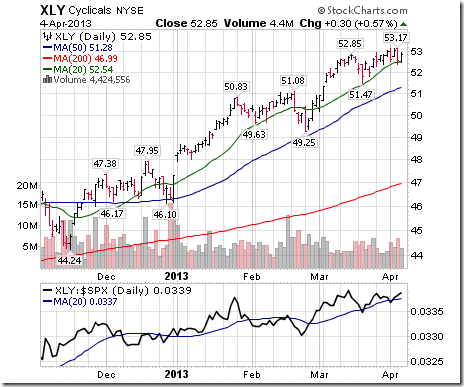
Technical score for Consumer Discretionary SPDRs remains at 3.0. Favourable seasonal influences end in mid-April.
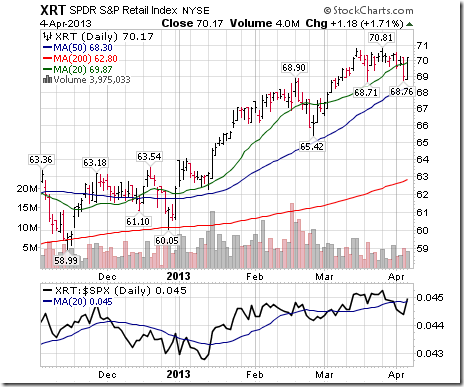
Technical score for Retail SPDRs slipped from 3.0 to 2.5 when strength relative to the S&P 500 Index changed from positive to neutral. Favourable seasonal influences end in mid-April.
Seasonal profit taking is recommended because technical score has decline to 0.0.
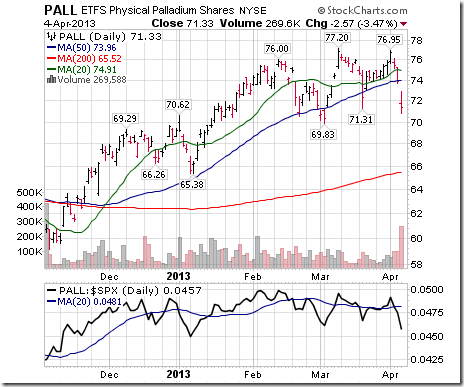
Technical score for Palladium changed from 2.5 to 0.0 on a break by Palladium below its 20 day moving average and support at $71.31as well as strength relative to S&P 500 turning negative.
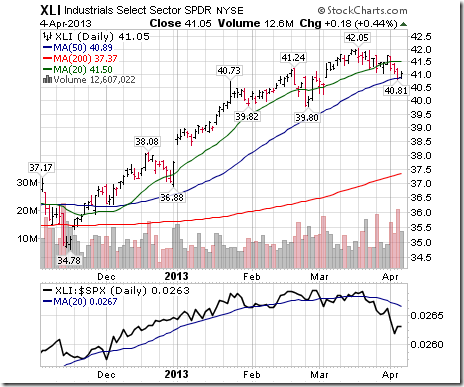
Technical score for Industrial SPDRs fell from 2.0 to 0.0 on a break below support at $41.00 and a move below its 20 day moving average.
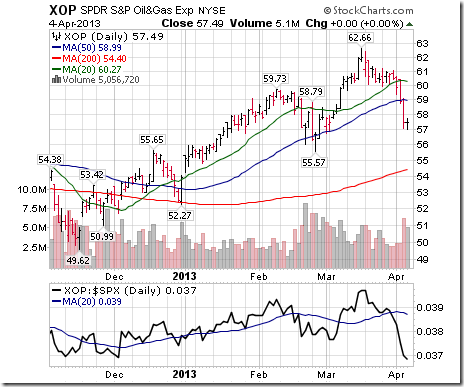
Technical score for Oil & Gas Exploration SPDRs fell from 2.5 to 0.0 on a break below support at $60 and a move below its 20 day moving average plus negative strength relative to S&P 500.
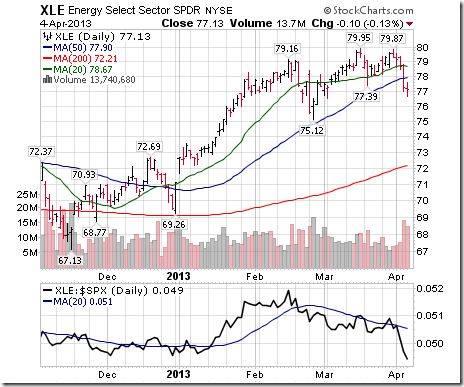
Technical score for Energy SPDRs changed from 3.0 to 0.0 on a break below support at $77.39 and a move below its 20 day moving average. Strength relative to the S&P 500 turned negative
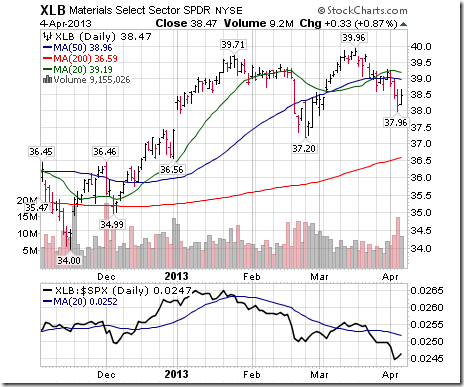
Technical score for Materials SPDRs changed from 1.0 to 0.0 when support at $38.58 was broken.
Special Free Services available through www.equityclock.com
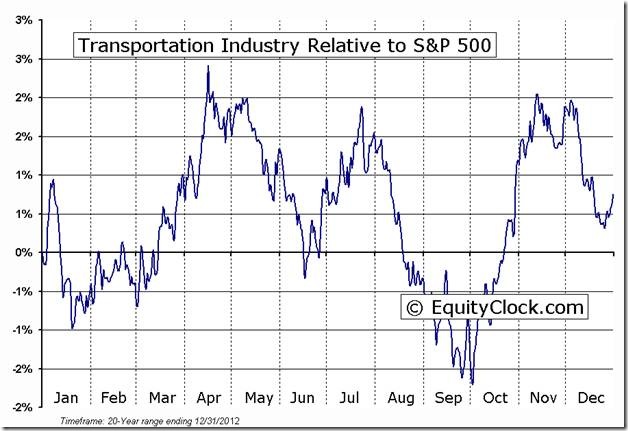
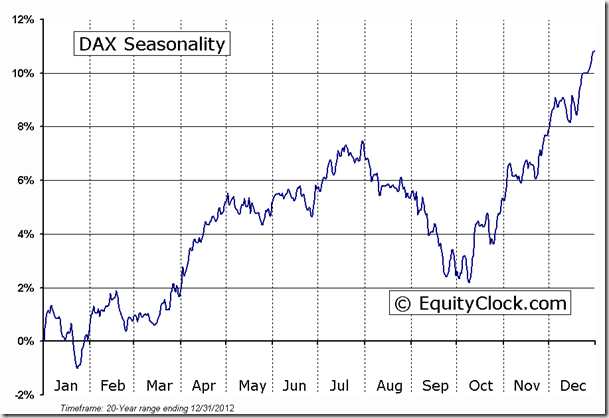
Equityclock.com is offering free access to a data base showing seasonal studies on individual stocks and sectors. The data base holds seasonality studies on over 1000 big and moderate cap securities and indices. Notice that most of the seasonality charts have been updated recently.
To login, simply go to http://www.equityclock.com/charts/
Following is an example:
Disclaimer: Comments and opinions offered in this report at www.timingthemarket.ca are for information only. They should not be considered as advice to purchase or to sell mentioned securities. Data offered in this report is believed to be accurate, but is not guaranteed.
Don and Jon Vialoux are research analysts for Horizons Investment Management Inc. All of the views expressed herein are the personal views of the authors and are not necessarily the views of Horizons Investment Management Inc., although any of the recommendations found herein may be reflected in positions or transactions in the various client portfolios managed by Horizons Investment Management Inc
Upcoming US Events for Today:
- Employment Situation for March will be released at 8:30am. The market expect Non-Farm Payrolls to increase by 193,000 versus 236,000 previous. Private Payrolls are expected to increase by 200,000 versus 246,000 previous. The Unemployment Rate is expected to remain steady at 7.7%.
- Trade Balance for February will be released at 8:30am. The market expects -$44.8B versus -$44.4B previous.
- Consumer Credit for February will be released at 3:00pm. The market expects $15.0B versus $16.2B previous.
Upcoming International Events for Today:
- Japan Leading Index for February will be released at 1:00am EST. The market expects 97.3 versus 95.0 previous.
- Euro-Zone Retail Sales for February will be released at 5:00am EST. The market expects a year-over-year decline of 1.2% versus a decline of 1.3% previous.
- German Factory Orders for February will be released at 6:00am EST. The market expects a year-over-year decline of 1.4% versus a decline of 2.5% previous.
- Canadian Labour Force Survey for March will be released at 8:30am EST. The market expects a net change in employment of 6.5K versus 50.7K previous. The Unemployment Rate is expected to remain unchanged at 7.0%.
- Canadian Ivey PMI for March will be released at 10:00am EST. The market expects 52.2 versus 51.1 previous.
Recap of Yesterday’s Economic Events:
| Event | Actual | Forecast | Previous |
| JPY Bank of Japan Rate Decision | 0.10% | 0.10% | 0.10% |
| EUR Italian Purchasing Manager Index Services | 45.5 | 43.3 | 43.6 |
| EUR French Purchasing Manager Index Services | 41.3 | 41.9 | 41.9 |
| EUR German Purchasing Manager Index Services | 50.9 | 51.6 | 51.6 |
| EUR Euro-Zone Purchasing Manager Index Services | 46.4 | 46.5 | 46.5 |
| EUR Euro-Zone Purchasing Manager Index Composite | 46.5 | 46.5 | 46.5 |
| GBP Purchasing Manager Index Services | 52.4 | 51.5 | 51.8 |
| EUR Euro-Zone Producer Price Index (MoM) | 0.20% | 0.20% | 0.40% |
| EUR Euro-Zone Producer Price Index (YoY) | 1.30% | 1.40% | 1.70% |
| GBP Bank of England Rate Decision | 0.50% | 0.50% | 0.50% |
| GBP BOE Asset Purchase Target | 375B | 375B | 375B |
| USD Challenger Job Cuts (YoY) | 30.00% | 7.00% | |
| USD RBC Consumer Outlook Index | 50.3 | 47.1 | |
| EUR European Central Bank Rate Decision | 0.75% | 0.75% | 0.75% |
| EUR ECB Deposit Facility Rate | 0.00% | 0.00% | 0.00% |
| USD Initial Jobless Claims | 385K | 353K | 357K |
| USD Continuing Claims | 3063K | 3050K | 3071K |
| USD EIA Natural Gas Storage Change | -94 | -92 | -95 |
The Markets
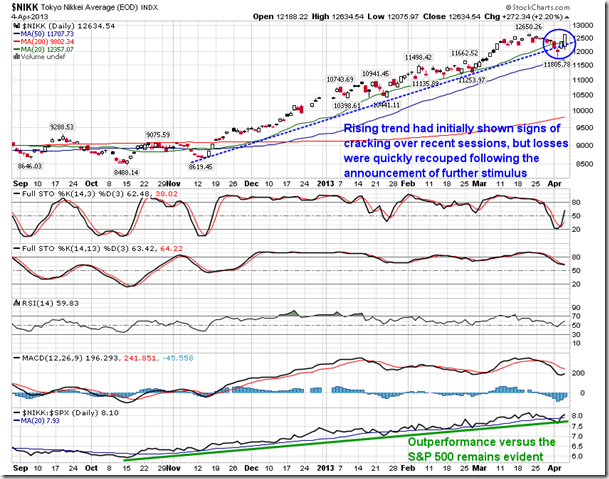
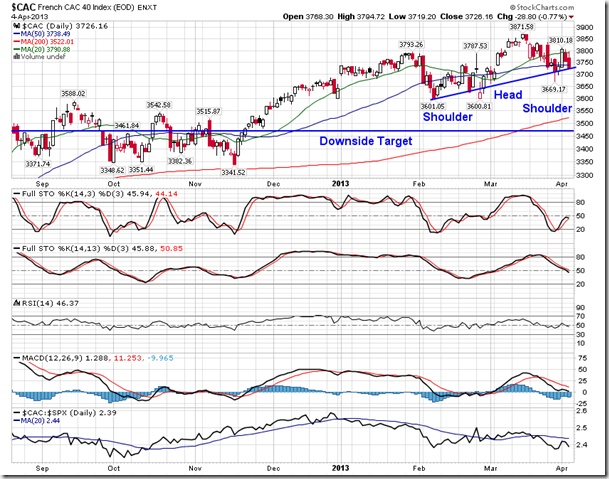
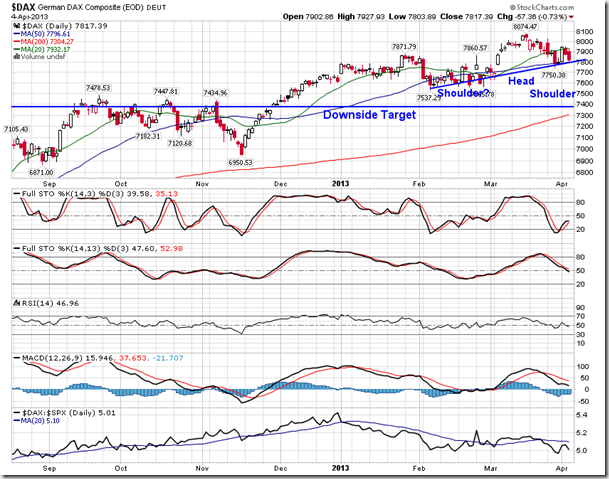
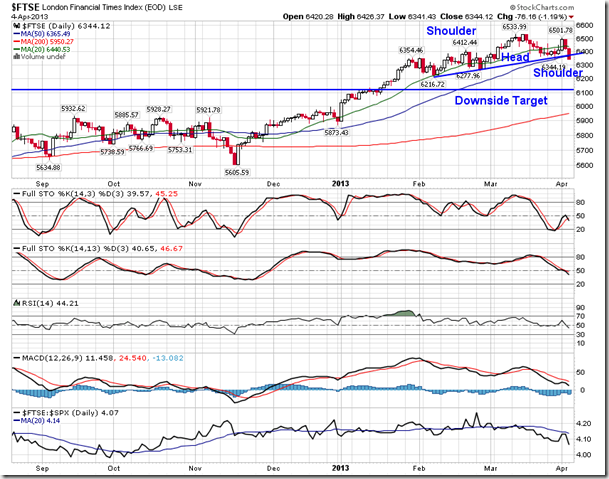
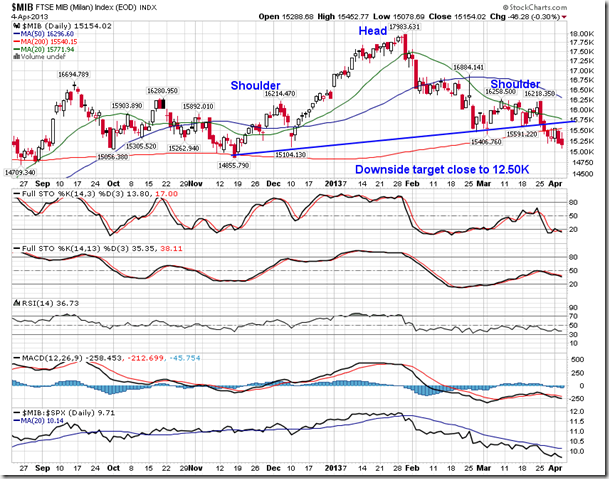
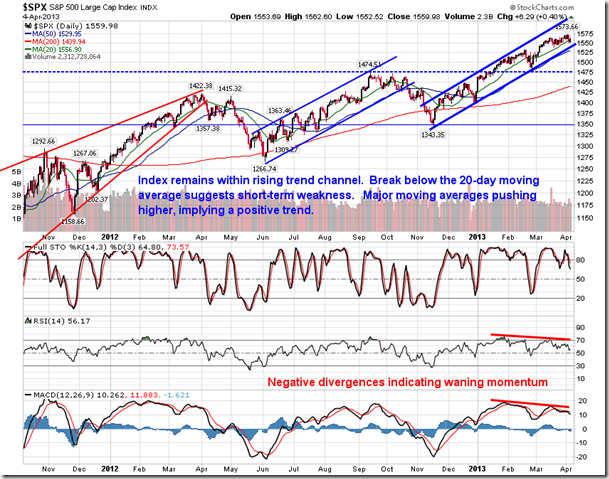
Markets snapped back from Thursday’s losses as investors reacted to central bank announcements from Japan, Great Britain, and the Euro-Zone. Japan announced plans to expand its stimulus program, while Great Britain and the Euro-Zone held steady with current policies. The Nikkei Average jumped over 500 points from the lows of the session, completely reversing declines realized over the last couple of weeks. European indices were not as fortunate, many of which have now carved out what appear to be head-and-shoulders topping patterns.
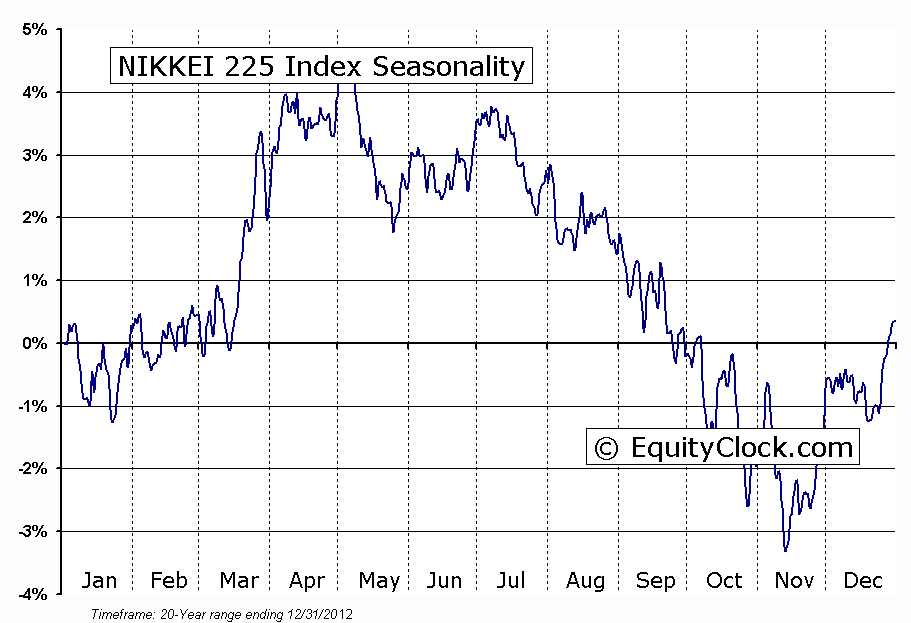
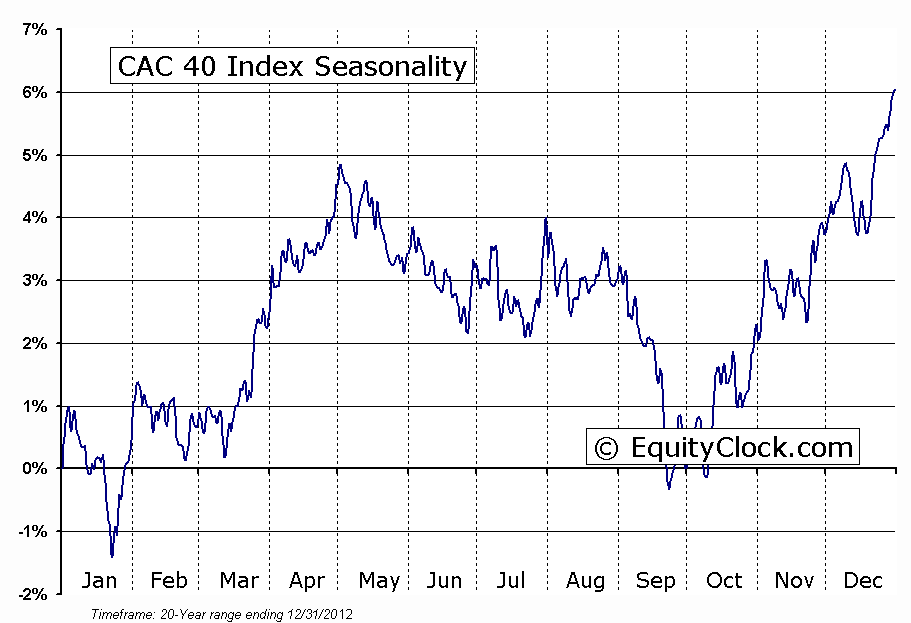
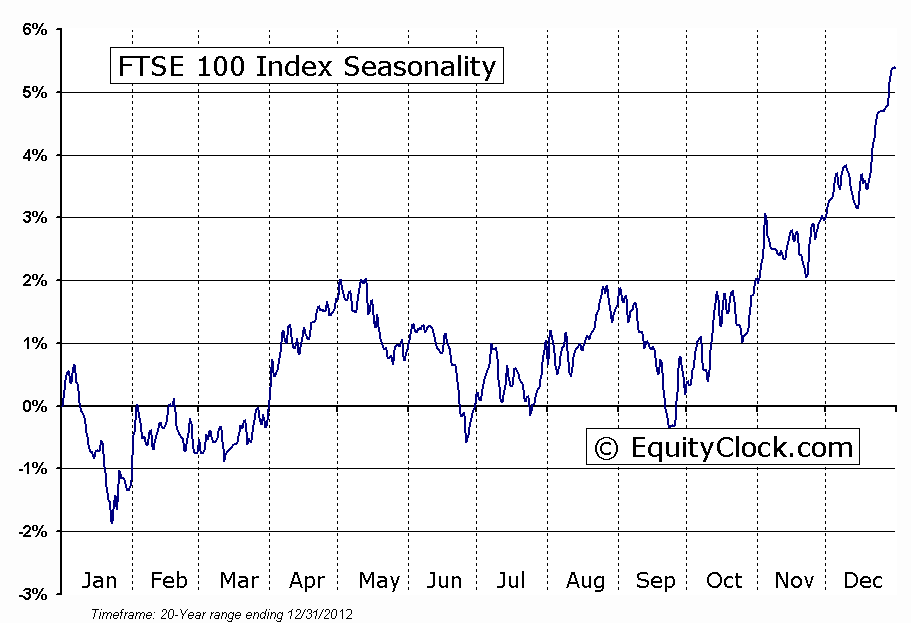
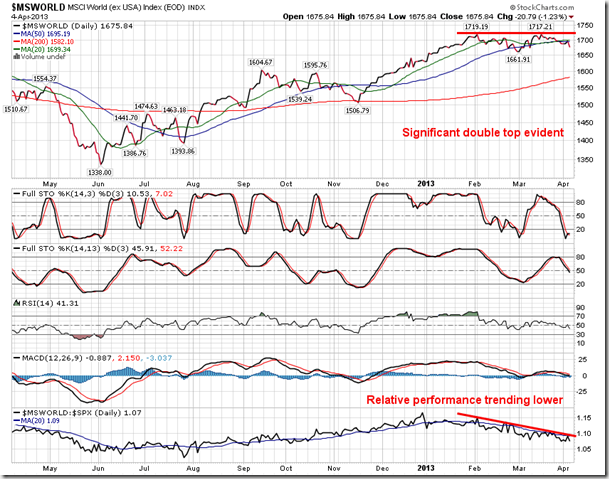
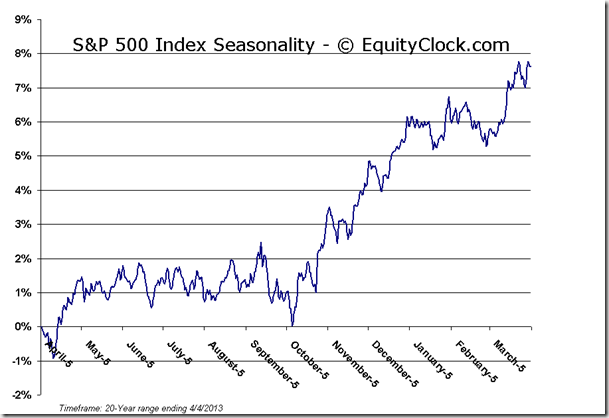
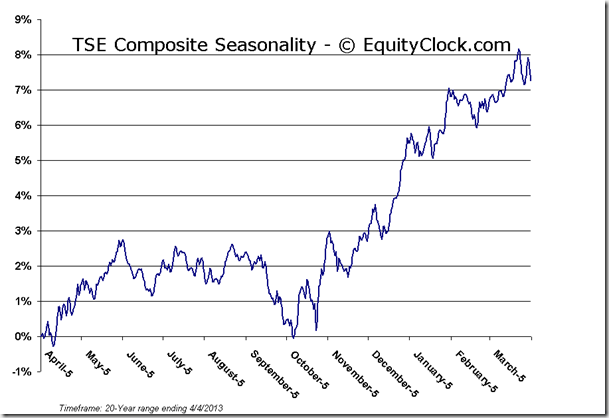
On the chart of the MSCI World (ex-USA), a double top pattern is evident. Indices around the globe are overwhelmingly showing bearish setups, the impact of which could bring upon the long-awaited correction in equity markets. Given the time of year, with the average “Sell in May” date just around the corner, we are within the window when sell signals are typically realized. Just as the market realized last year, it is increasingly likely that a Sell in April event will be realized given the technical Sell signals that are becoming ubiquitous.
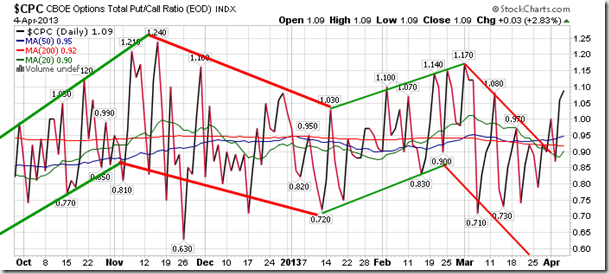
Sentiment on Thursday, as gauged by the put-call ratio, ended bearish at 1.09. Investors were noticed hedging portfolios prior to Friday’s always important employment report. Expectations have been lowered as a result of recent economic misses and the uncertainty surrounding the event is keeping investors cautious.
Chart Courtesy of StockCharts.com
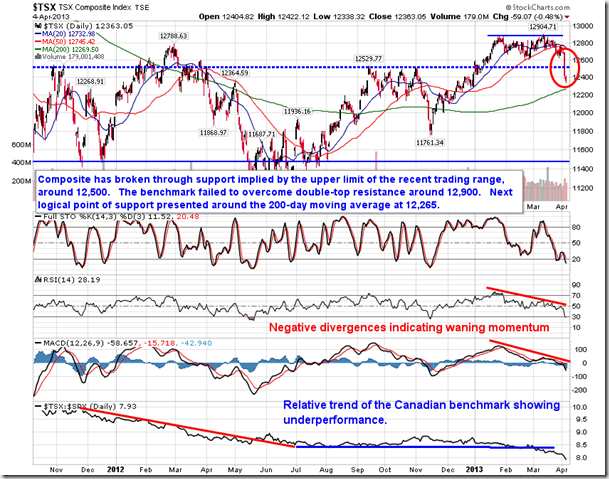
Chart Courtesy of StockCharts.com
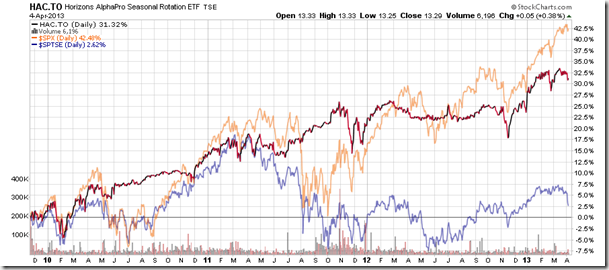
Horizons Seasonal Rotation ETF (TSX:HAC)
- Closing Market Value: $13.29 (up 0.38%)
- Closing NAV/Unit: $13.32 (up 0.46%)
Performance*
| 2013 Year-to-Date | Since Inception (Nov 19, 2009) | |
| HAC.TO | 4.72% | 33.2% |
* performance calculated on Closing NAV/Unit as provided by custodian
Click Here to learn more about the proprietary, seasonal rotation investment strategy developed by research analysts Don Vialoux, Brooke Thackray, and Jon Vialoux.
Copyright © TechTalk


