by Don and Jon Vialoux, Tech Talk
Pre-opening Comments for Wednesday March 27th
U.S. equity index futures are lower this morning. S&P 500 futures are down 7 points in pre-opening trade. Index futures are responding to continuing turmoil in Italy as its politicians jockey to form a coalition government.
The Canadian Dollar recovered slightly following release of the February Consumer Price report. Consensus for CPI was a gain of 0.7% from January. Actual was an increase of 1.2%. Consensus for year-over-year CPI was a gain of 0.8%. Actual was an increase of 1.2%. Consensus for core CPI on a year-over-year basis was a gain of 1.0%. Actual was 1.4%
Ingersoll-Rand (IR $55.55) is expected to open lower after JP Morgan downgraded the stock from Overweight to Neutral. Target was reduced from $53 to $41.
General Mills (GIS $48.63) is expected to open higher after Argus upgraded the stock from Hold to Buy. Target is $57.
Weekly Select Sector SPDRs Review
(Including technical scores: 0.0-3.0 with 3.0 being the highest score)
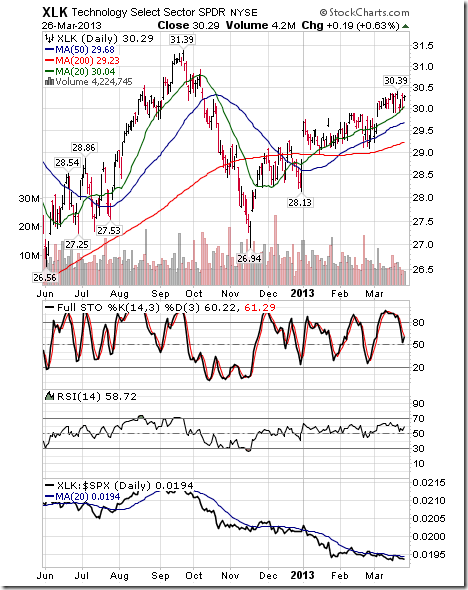
Technology
· Intermediate trend remains up.
· Units remain above their 20, 50 and 200 day moving averages.
· Strength relative to the S&P 500 Index remains neutral
· Technical score remains at 2.5.
· Short term momentum indicators are overbought and rolling over.
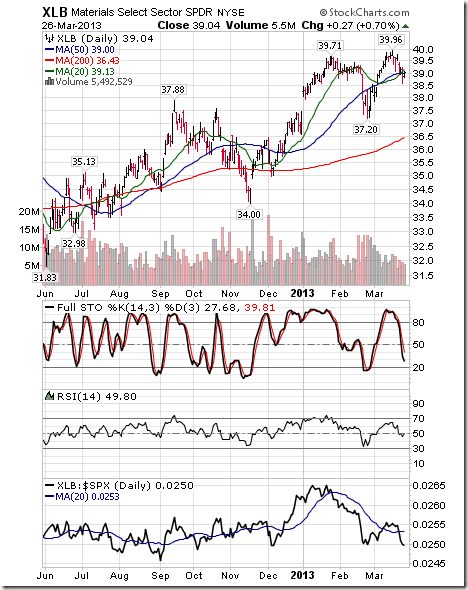
Materials
· Intermediate trend remains up.
· Units fell below their 20 day moving average.
· Strength relative to the S&P 500 Index changed from positive to negative
· Technical score fell from 3.0 to 1.0.
· Short term momentum indicators are trending down.
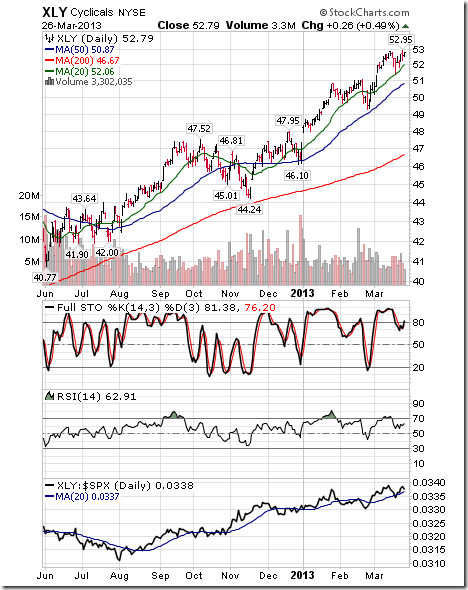
Consumer Discretionary
· Intermediate trend remains up.
· Units remain above their 20, 50 and 200 day moving averages
· Strength relative to the S&P 500 Index changed from neutral to positive
· Technical score improved from 2.5 to 3.0
· Short term momentum indicators are rolling over from overbought levels.
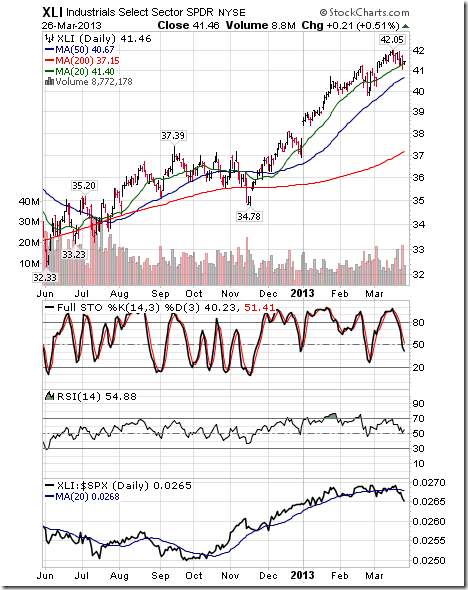
Industrials
· Intermediate trend remains up.
· Units remain above their 20, 50 and 200 day moving averages
· Strength relative to the S&P 500 Index changed from neutral to negative
· Technical score changed from 2.5 to 2.0
· Short term momentum indicators are trending down.
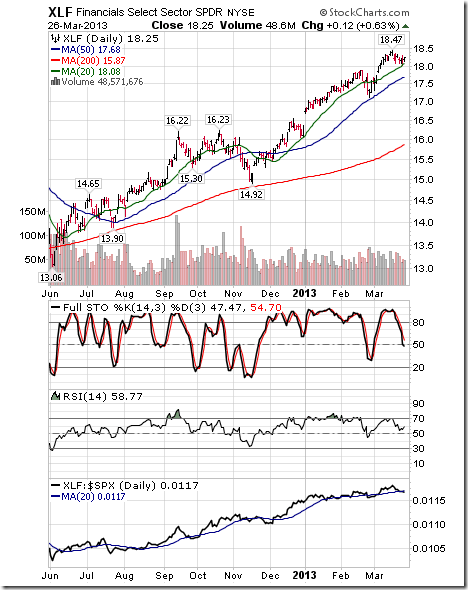
Financials
· Intermediate trend remains up.
· Units remain above their 20, 50 and 200 day moving averages.
· Strength relative to the S&P 500 Index changed from positive to neutral
· Technical score slipped from 3.0 to 2.5
· Short term momentum indicators are trending down
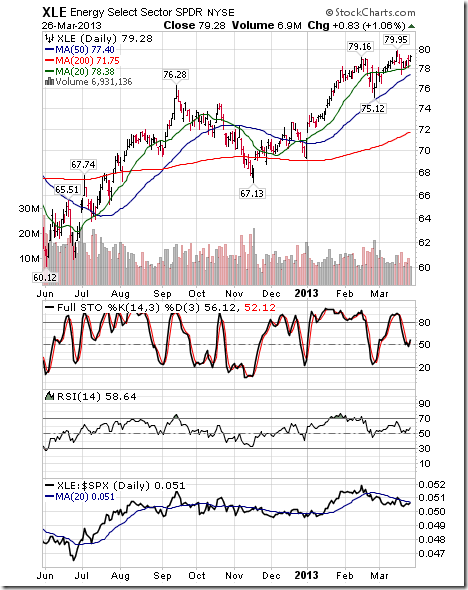
Energy
· Intermediate trend remains up.
· Units remain above their 20, 50 and 200 day moving averages
· Strength relative to the S&P 500 Index changed from negative to neutral
· Technical score improved from 2.0 to 2.5.
· Short term momentum indicators are trending down.
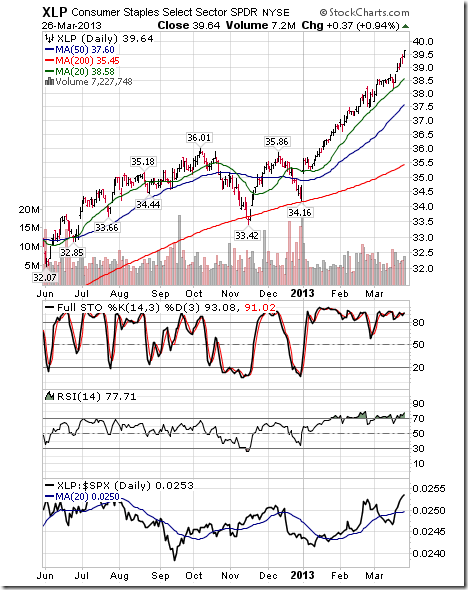
Consumer Staples
· Intermediate trend remains up.
· Units remain above their 20, 50 and 200 day moving averages
· Strength relative to the S&P 500 Index remains positive
· Technical score remains 3.0
· Short term momentum indicators remain overbought.
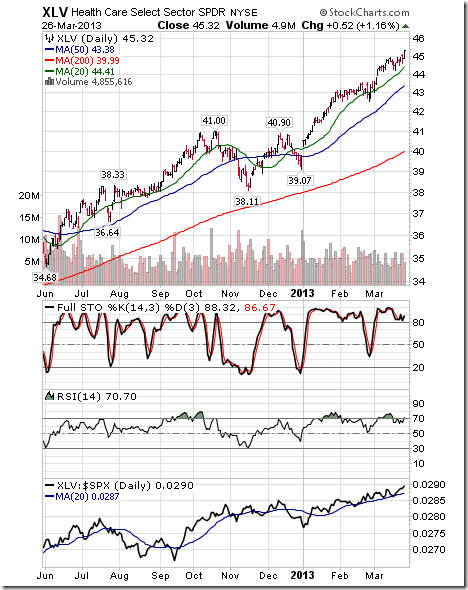
Health Care
· Intermediate trend remains up.
· Units remain above their 20, 50 and 200 day moving averages
· Strength relative to the S&P 500 Index remains positive.
· Technical score remains 3.0
· Short term momentum indicators remain overbought
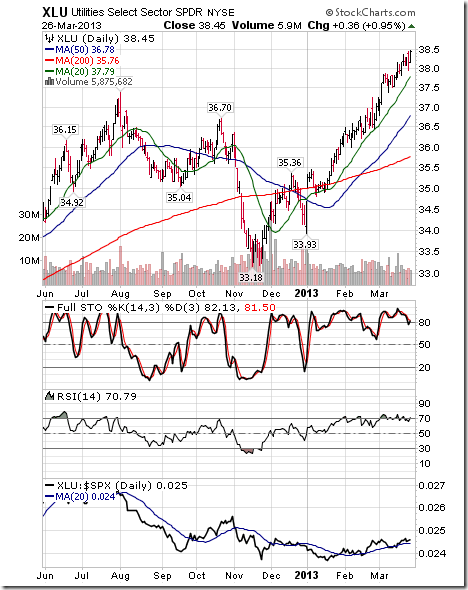
Utilities
· Intermediate trend remains up.
· Units remain above their 20, 50 and 200 day moving averages
· Strength relative to the S&P 500 Index remains positive
· Short term momentum indicators remain overbought.
INVESTMENT COMMENTARY
Wednesday, March 27, 2013
The latest issue of the CastleMoore Investment News where we write on the big picture stuff is about to hit the presses. If you want to read our bi-monthly letter sign up http://www.castlemoore.com/investorcentre/signup.php.
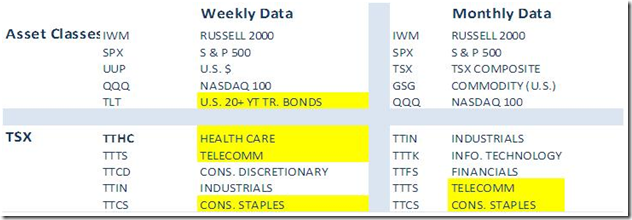
ASSET & TSX SECTOR HEAT MAPPING
Comments: Of note over the last month is the stalling of some of the sectors that performed well since the fall, such as financials and industrials, and the complete absence of others like base metals. In addition, strength has been seen in bonds, telecom, consumer staples and healthcare. Healthcare, especially in the US appears to be at the front edge of a secular wave (more on this below)
CHARTS of the WEEK
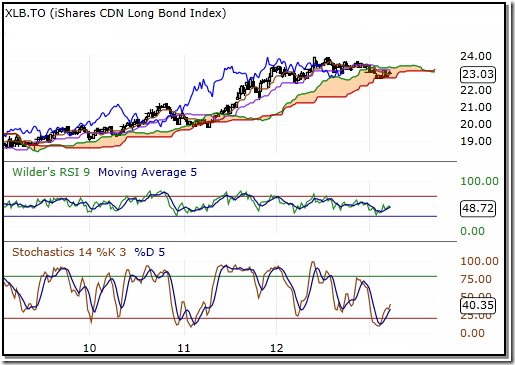
Canadian Long Bonds
Though Canadian bonds didn’t make the top 5 in the weekly asset class rankings, they have been moving up. This Ichimoku chart of a Canadian ETF bond basket, which also includes corps, has been bouncing off the lower cloud (support). CMI POSITION
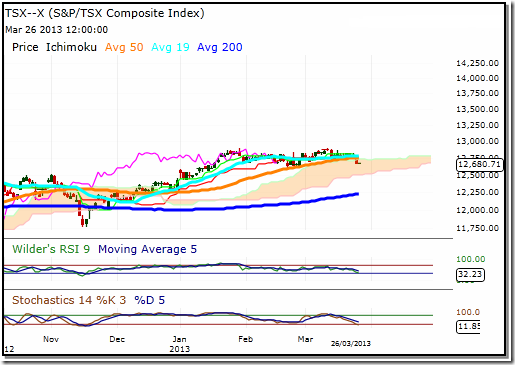
TSX Composite
This weekly chart of the TSX shows the index breaking its 50 day moving average. Sentiment is at the lower end, but sentiment is a poor timing indicator. Resistance in the 12,800 range was formidable, especially without any lifting by the resource sector. A break of the lower cloud band (12,550ish) would be bearish. NO CMI POSITION
Gold Bullion
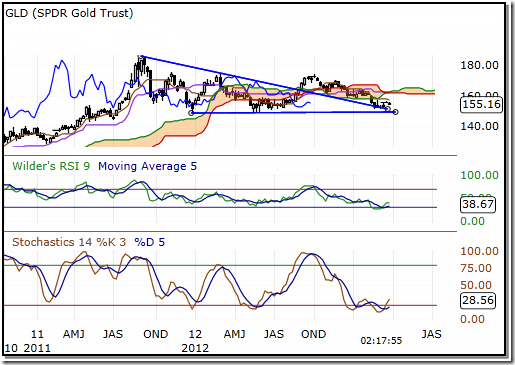
Gold bullion has been enigmatic, if anything (and don’t get some investors started on the producers). The $1550 level on a weekly close is an important level. Gold historically does not move in tandem with inflation as is the conventional wisdom but with currency volatility. The major currencies, with the exception of the Yen, have been relatively stable. CMI POSITION
Financials
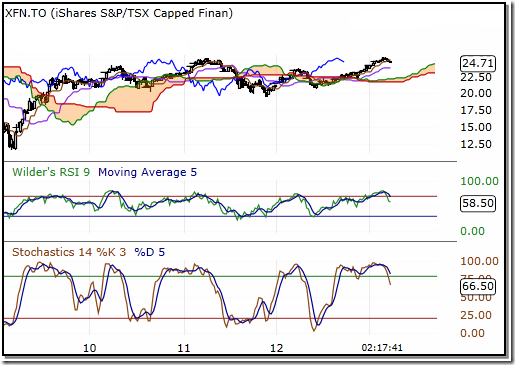
This monthly look at the Canadian financial services sector ETF (XFN) shows that the 2011 levels could not be breached. The 50d MA (not shown) was broken at the $24.88 level. Breaking the 50d MA is not necessarily significant for investors (vs. short term or swing traders) as this happened in November 2011 and prices moved higher, but at that time the 200d MA (or deep support) was only 1.5% form the 50d MA. Today it’s closer to 8%. NO CMI POSITION
Pfizer
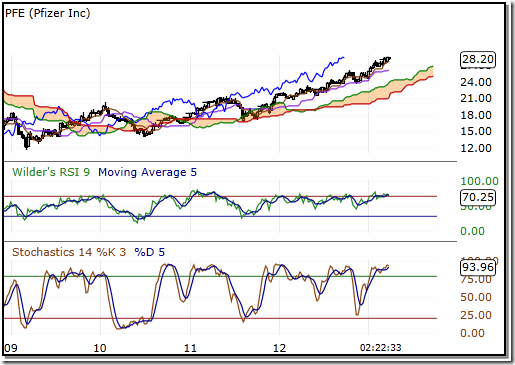
Pfizer is in a long term secular bull market which began in 2012 around $23.00. Short term the stock (and sector) is over extended. Any sector (or stock) pullback may be an opportunity. The stock has seasonal strength through to June. CMI POSITION
George Weston
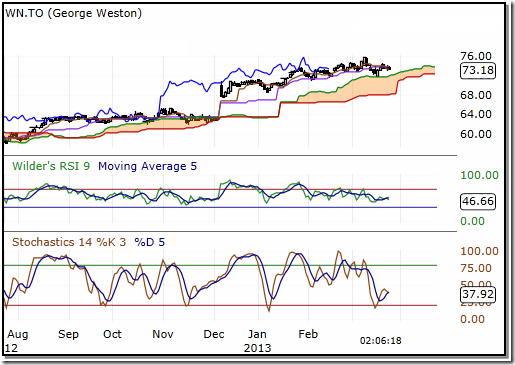
This intermediate term look at George Weston shows further evidence as was indicated by the heat mapping off the top of defensive or predictable growth and distributions. We have highlighted our interest in WN on BNN several times. The break out in December was important on the weekly and monthly charts. CMI POSITION
If you like to receive bi-monthly newsletter, know more about our model portfolios or access an audio file of our investment philosophy, “Modern Financial Fiascos”, click on the link
http://www.castlemoore.com/investorcentre/signup.php.
CastleMoore Inc. uses a proprietary Risk/Reward Matrix that places clients with minimum portfolios of $500,000 within one of 12 discretionary portfolios based on risk tolerance, investment objectives, income, net worth and investing experience. For more information on our methodology please contact us.
CastleMoore Inc.
Buy, Hold…and Know When to Sell
This commentary is not to be considered as offering investment advice on any particular security or market. Please consult a professional or if you invest on your own do your homework and get a good plan, before risking any of your hard earned money. The information provided in CastleMoore Investment Commentary or News, a publication for clients and friends of CastleMoore Inc., is intended to provide a broad look at investing wisdom, and in particular, investment methodologies or techniques. We avoid recommending specific securities due to the inherent risk any one security poses to ones’ overall investment success. Our advice to our clients is based on their risk tolerance, investment objectives, previous market experience, net worth and current income. Please contact CastleMoore Inc. if you require further clarification on this disclaimer.
CSTA News
Next KWGC Meeting
Topic: Timing the Market using Seasonal Patterns and Technical Analysis by Don Vialoux.
The next meeting will be held : Thursday April 4th
The meeting is to be held at: Hampton Inn & Suites, 4355 King Street East
Our meeting starts at: 7:30 pm
Everyone is welcome. Please register at www.csta.org
Disclaimer: Comments and opinions offered in this report at www.timingthemarket.ca are for information only. They should not be considered as advice to purchase or to sell mentioned securities. Data offered in this report is believed to be accurate, but is not guaranteed.
Don and Jon Vialoux are research analysts for Horizons Investment Management Inc. All of the views expressed herein are the personal views of the authors and are not necessarily the views of Horizons Investment Management Inc., although any of the recommendations found herein may be reflected in positions or transactions in the various client portfolios managed by Horizons Investment Management Inc
Horizons Seasonal Rotation ETF HAC March 26th 2013
Copyright © Tech Talk


