by Don Vialoux, TechTalk
Pre-opening Comments for Thursday March 21st
U.S. equity index futures are mixed this morning. S&P 500 futures are unchanged in pre-opening trade.
Index futures were virtually unchanged following release of the weekly initial jobless claims report. Consensus was an increase to 345,000 from a revised 334,000. Actual was an increase to 336,000.
Canadian investors are waiting for release of the Federal Government budget at 4:00 PM EDT.
Yahoo added $0.37 to $22.46 after Oppenheimer upgraded the stock from Perform to Outperform. Target was raised from $22 to $27.
Oracle fell $2.72 to $33.05 after reporting less than consensus third quarter revenues. Also, the stock was downgraded by CLSA to Under Perform from Outperform and by Evercore from Overweight to Equal Weight.
Cisco fell $0.48 to $21.19 after FBR Capital downgraded the stock from Market Perform to Under Perform. Target was reduced from $22 to $17.
Canadian Pacific fell $0.42 to US$128.22 after Goldman Sachs downgraded the stock from Conviction Buy to Buy.
Technical Watch
Oracle Corp. (NASDAQ:ORCL) – $33.05 fell 7.6% after reporting lower than consensus third quarter revenues. The stock also was downgraded by CLSA and Evercore. The stock has a deteriorating technical profile. Intermediate trend changed from up to down overnight when the stock fell below support at $34.00 and completed a double top pattern. The stock also will open below its 20 and 50 day moving averages. Strength relative to the S&P 500 Index turned negative at the end of January. Short term momentum indicators are trending down. Better opportunities exist elsewhere.
Interesting Charts
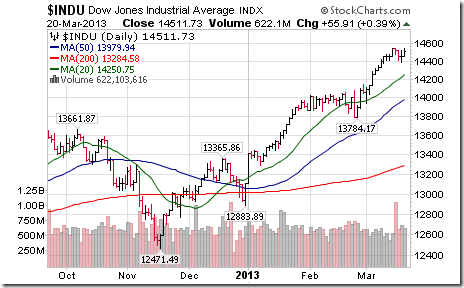
The Dow Jones Industrial Average managed to reach an all-time inter-day high yesterday.
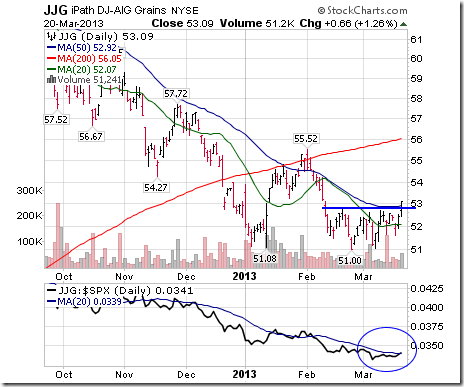
The grain complex is “waking up” after a long period of underperformance.
Weekly Select Sector SPDRs Review
(Including technical scores: 0.0-3.0 with 3.0 being the highest score)
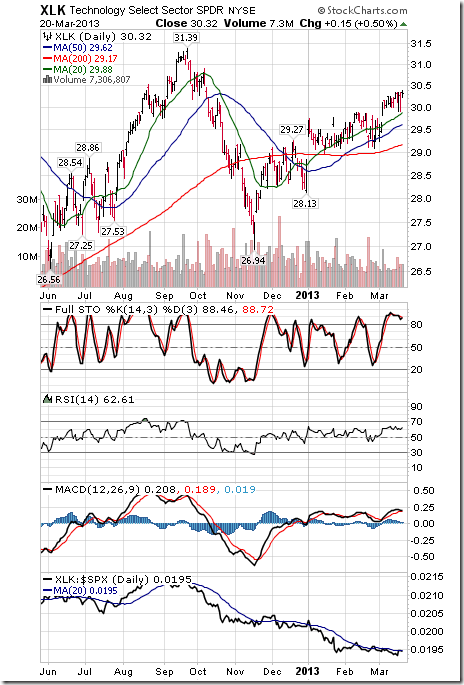
Technology
· Intermediate trend remains up.
· Units remain above their 20, 50 and 200 day moving averages
· Strength relative to the S&P 500 Index changed from negative to neutral.
· Technical score improved from 2.0 to 2.5
· Short term momentum indicators remain overbought.
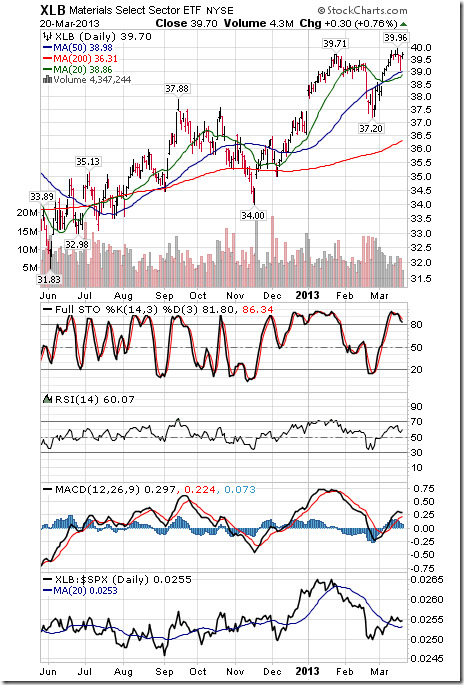
Materials
· Intermediate trend remains up.
· Units remain above their 20, 50 and 200 day moving averages
· Strength relative to the S&P 500 Index remains positive.
· Technical score remains at 3.0
· Short term momentum indicators remain overbought.
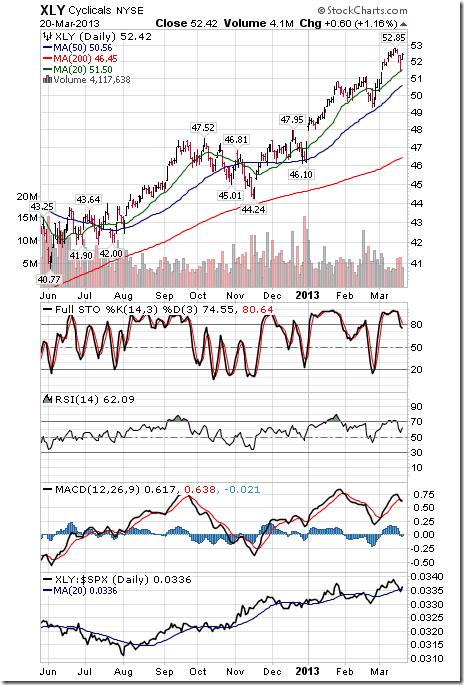
Consumer Discretionary
· Intermediate trend remains up.
· Units remain above their 20, 50 and 200 day moving averages
· Strength relative to the S&P 500 Index changed from positive to neutral
· Technical score slipped from 3.0 to 2.5
· Short term momentum indicators remain overbought
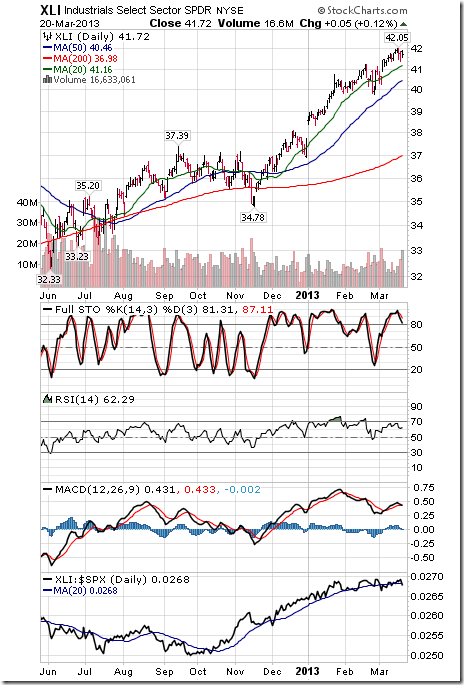
Industrials
· Intermediate trend is up.
· Units remain above their 20, 50 and 200 day moving averages
· Strength relative to the S&P 500 Index remains neutral
· Technical score remains at 2.5
· Short term momentum indicators remain overbought.
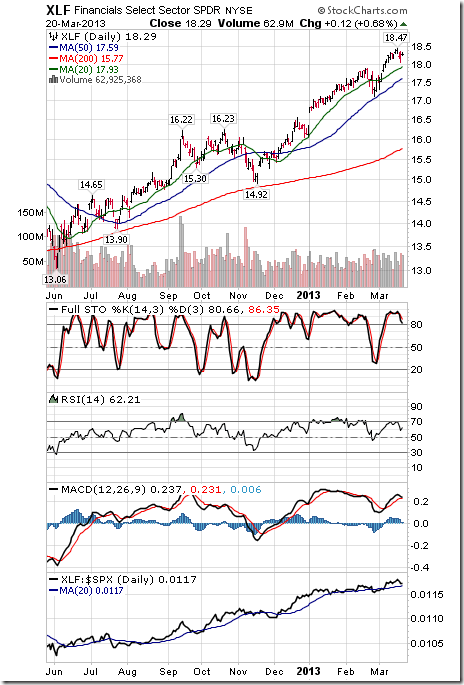
Financials
· Intermediate trend is up.
· Units remain above their 20, 50 and 200 day moving averages
· Strength relative to the S&P 500 Index remains positive
· Technical score remains at 3.0
· Short term momentum indicators remain overbought.
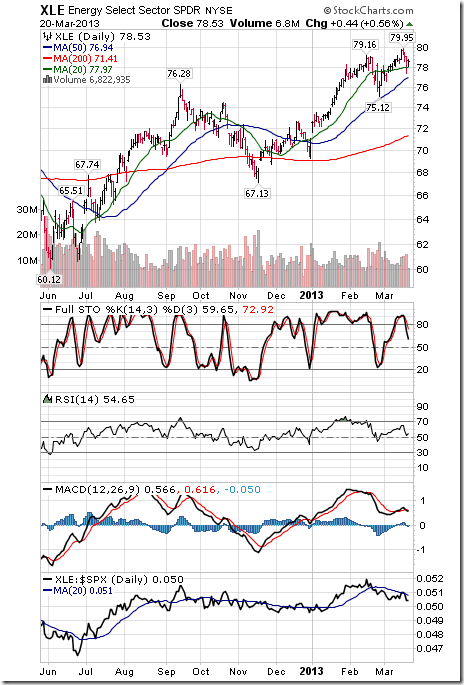
Energy
· Intermediate trend is up.
· Units remain above their 20, 50 and 200 day moving averages.
· Strength relative to the S&P 500 Index changed from neutral to negative
· Technical score slipped from 2.5 to 2.0
· Short term momentum indicators have rolled over from overbought levels.
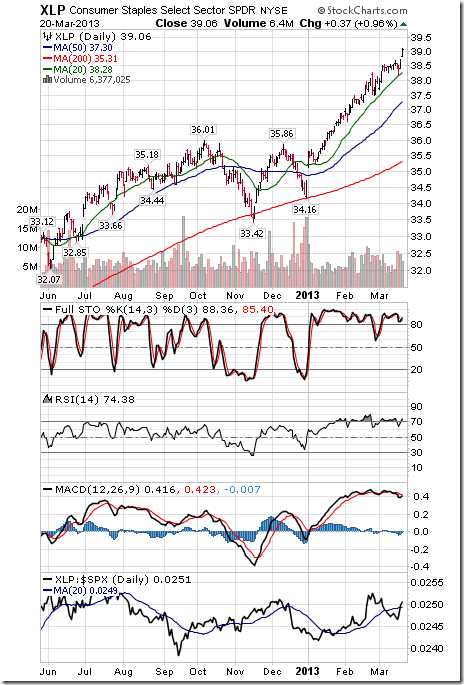
Consumer Staples
· Intermediate trend remains up.
· Units remain above their 20, 50 and 200 day moving averages
· Strength relative to the S&P 500 Index changed from neutral to positive
· Technical score improved from 2.5 to 3.0
· Short term momentum indicators remain overbought
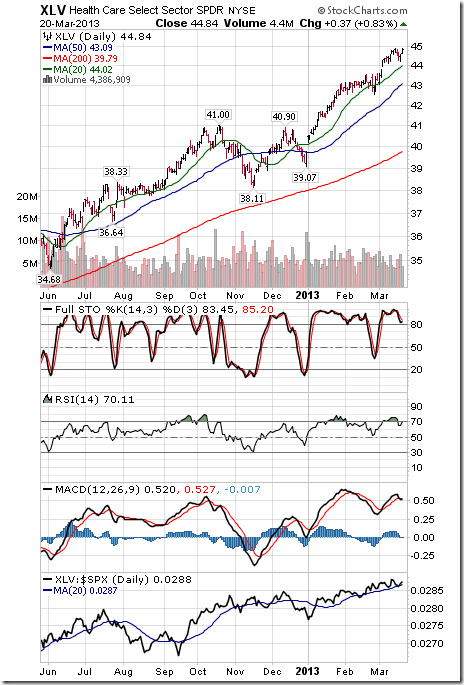
Health Care
· Intermediate trend remains up.
· Units remains above its 20, 50 and 200 day moving averages
· Strength relative to the S&P 500 Index remains positive
· Technical score remains at 3.0
· Short term momentum indicators remain overbought.
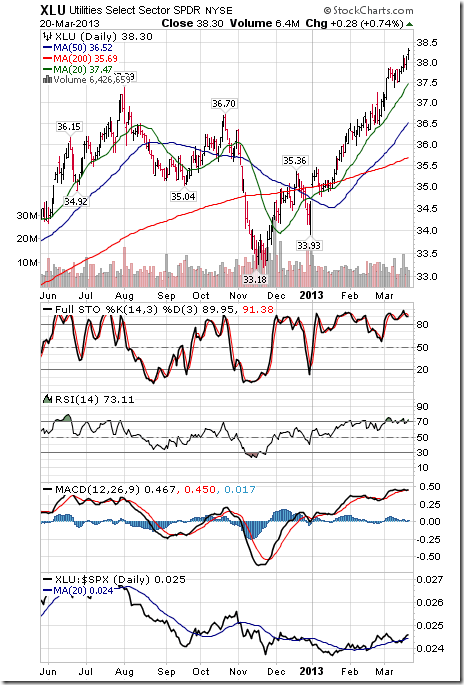
Utilities
· Intermediate trend remains up.
· Units remain above their 20, 50 and 200 day moving averages.
· Strength relative to the S&P 500 Index changed from neutral to positive
· Technical score improved from 2.5 to 3.0
· Short term momentum indicators remain overbought
Special Free Services available through www.equityclock.com
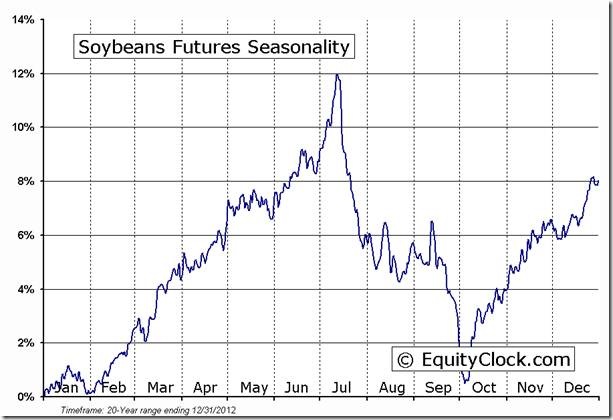
Equityclock.com is offering free access to a data base showing seasonal studies on individual stocks and sectors. The data base holds seasonality studies on over 1000 big and moderate cap securities and indices. Notice that most of the seasonality charts have been updated recently.
To login, simply go to http://www.equityclock.com/charts/
Following is an example:
Soybeans Futures (S) Seasonal Chart
FUTURE_S1 Relative to the S&P 500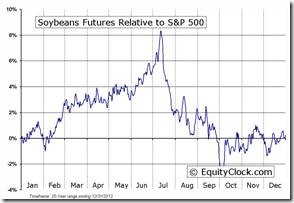 |
FUTURE_S1 Relative to Gold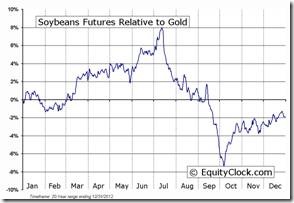 |
Disclaimer: Comments and opinions offered in this report at www.timingthemarket.ca are for information only. They should not be considered as advice to purchase or to sell mentioned securities. Data offered in this report is believed to be accurate, but is not guaranteed.
Don and Jon Vialoux are research analysts for Horizons Investment Management Inc. All of the views expressed herein are the personal views of the authors and are not necessarily the views of Horizons Investment Management Inc., although any of the recommendations found herein may be reflected in positions or transactions in the various client portfolios managed by Horizons Investment Management Inc
Horizons Seasonal Rotation ETF HAC March 20th 2013
Copyright © TechTalk


![clip_image001[1] clip_image001[1]](https://advisoranalyst.com/wp-content/uploads/HLIC/98b0b817a9ec680fbc609f5974f5574c.png)
![clip_image002[1] clip_image002[1]](https://advisoranalyst.com/wp-content/uploads/HLIC/0464effd7ca3665510dc32bd7ce6dabf.png)


