More often than not when we are first talking to an advisor who has not viewed SIA Charts before we run into a very familiar scenario: If they are Canadian, they are overweighted in Canada, and if they are American, then they are overweighted in the U.S. For this weeks SIA Equity Leaders Weekly, we are going to focus in on the most recent change between those two asset classes and what two of the most popular sectors in Canada have done since that change.
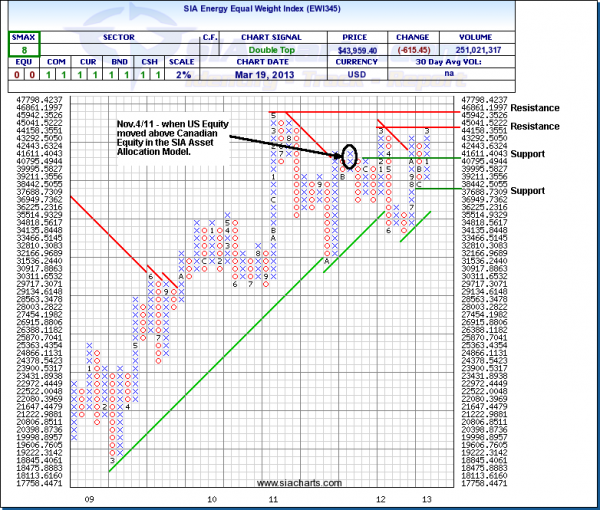
SIA Equal Weight Energy Index
On November 4, 2011, U.S. Equity moved above Canadian Equity in the SIA Asset Allocation Model. At that time, our clients should have been moving more heavily into U.S. Equity based positions and also started to reduce their Canadian exposure. Looking at the chart to the right of the SIA Energy Equal Weight Index, we can see that since that time this index has moved up slightly, roughly 6%. Over that same time frame the TSX was up almost 3%. Impressive to be able to double the TSX, but the problem lies in that the S&P 500 was up over 23% during this same time period.
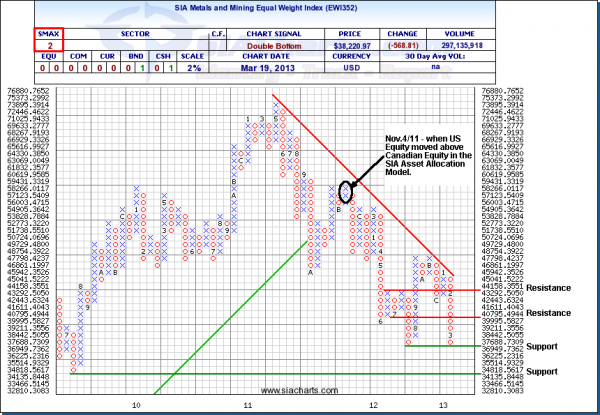
SIA Metals and Mining Equal Weight Index
A second common sector that advisors have been clinging to in Canada is the Metals and Mining sector. The chart to the right shows a steady decline from that Nov. 4/11 date, and has moved down nearly 34% over that time frame. This is something that could have been avoided by following the Asset Allocation Model, but also by following the stock sector report rankings as well. On Nov. 4/11, Energy was down in the bottom of the Neutral zone in the 16th spot, and Metals and Mining was in the 27th spot, near the bottom of the Unfavored zone. Now fast forward to present and Energy is in 29th spot and Metals and Mining is now at the bottom of the Unfavored zone in 31st spot.
By focusing in on the stronger asset classes and also by focusing in on the stronger sectors, advisors can help their clients reduce risk and maximize the potential for outperformance. Getting married to a position sometimes does the opposite of this and puts clients at great risk.
Copyright © <a href="http://www.siacharts.com/">SIACharts.com</a>


