by Don Vialoux, TechTalk
Upcoming US Events for Today:
- Trade Balance for January will be released at 8:30am. The market expects -$43.0B versus -$38.5B previous.
- Weekly Jobless Claims will be released at 8:30am. The market expects 355K versus 344K previous.
- Productivity for the Fourth Quarter will be released at 8:30am. The market expects a quarter-over-quarter decline of 1.6% versus a decline of 2.0% previous. Unit Labour Costs are expected to increase by 4.4% versus an increase of 4.5% previous.
- Consumer Credit for January will be released at 3:00pm. The market expects $15.0B versus $14.6B previous.
- Chain Store Sales for February will be released throughout the day.
Upcoming International Events for Today:
- German Factory Orders for January will be released at 6:00am EST. The market expects a year-over-year decline of 1.9% versus a decline of 1.8% previous.
- The Bank of England Rate Announcement will be released at 7:00am EST. The market expects no change at 0.5%.
- ECB Rate Decision will be released at 7:45am EST. The market expects no change at 0.75%.
- ECB’s Mario Draghi Holds Press Conference After Rate Decision at 8:30am EST.
- Canadian Building Permits for January will be released at 8:30am EST. The market expects a month-over-month increase of 5.3% versus a decline of 11.2% previous.
- Canadian Trade Balance for January will be release at 8:30am EST. The market expects –C$0.6B versus -C$0.9B previous.
- Japan GDP for the Fourth Quarter will be released at 6:50pm EST. The market expects no change (0.0%) on a quarter-over-quarter basis versus a decline of 0.1% previous.
The Markets
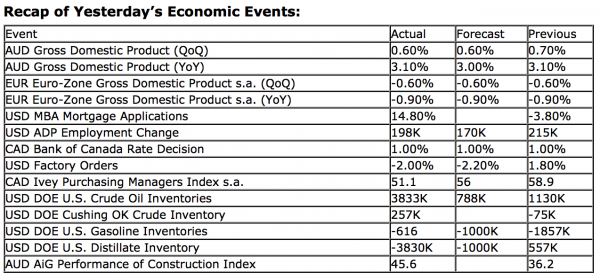
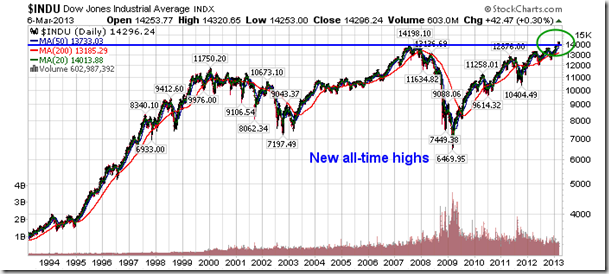
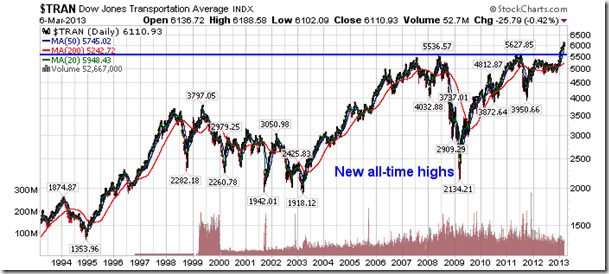
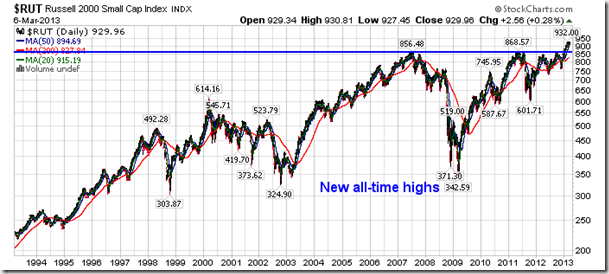
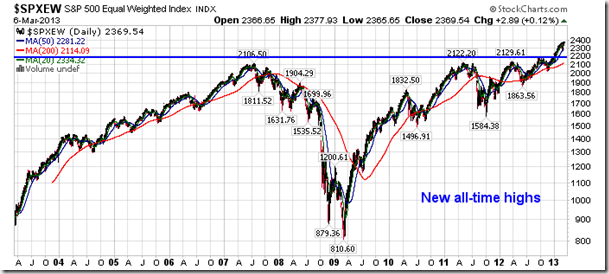
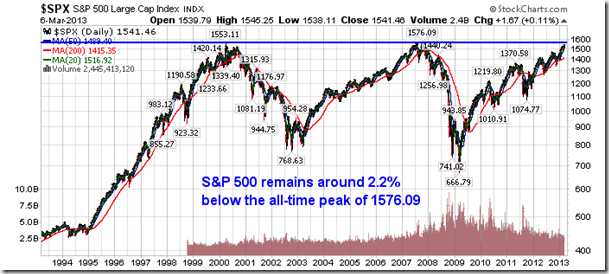
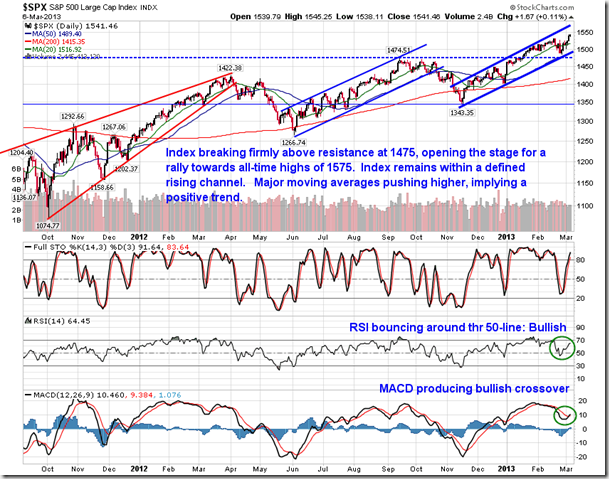
Equity markets followed through with their recent breakout gains on Wednesday amidst a better than expected read on employment in the US. ADP reports that 198,000 jobs were added in February, well above the consensus of around 170,000. The report sets an optimistic tone leading into Friday’s BLS report on the current state of employment in the US. On Tuesday the Dow Jones Industrial Average broke out to new all-time highs, following recent breakouts to new all-time highs in the Dow Jones Transportation Average, Russell 2000 Index, and the S&P 500 Equally Weighted index. The S&P 500 Index remains around 2.2% below the all-time peak of 1576.09. But more importantly than the fact that equity benchmarks are breaking out to new all-time highs is the simple fact that the vast majority of equity benchmarks are charting new highs within the current trend, defining new multi-year or recovery highs. The trend amongst major equity indices is that of higher-highs and higher-lows, both on a long-term and intermediate basis. In the event that a lower-high is revealed, that is the point to start booking profits in equity positions.
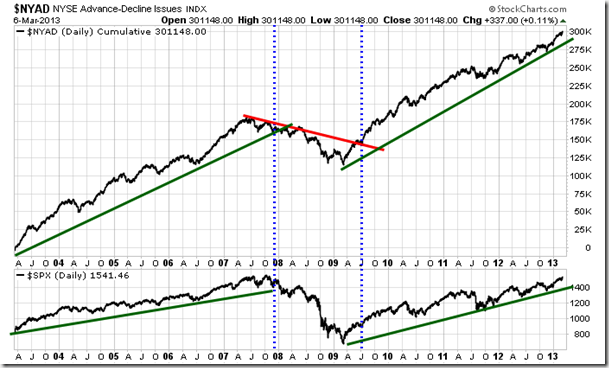
In addition to equity benchmarks breaking out to new all-time highs, so too is the NYSE Cumulative Advance-Decline line. This technical indicator continues to maintain its positive long-term trend stemming from the March 2009 low suggesting that market breadth remains positive. When this indicator ceases to make new highs and the trend of higher-highs and higher-lows comes to an end, a leading indication of a long-term peak would likely be provided, as it was in 2007. No inactions here of a market peak, as of yet.
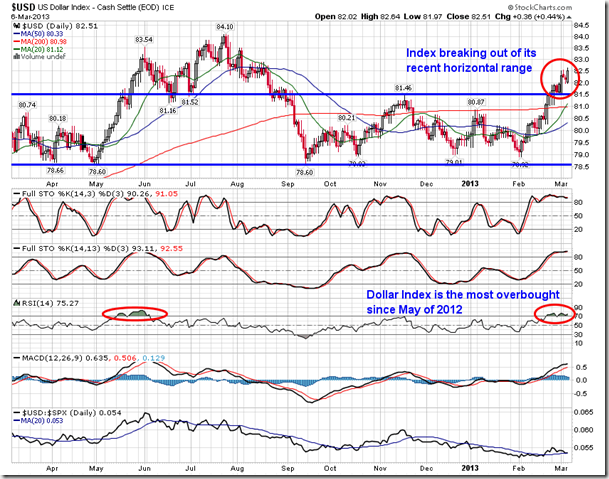
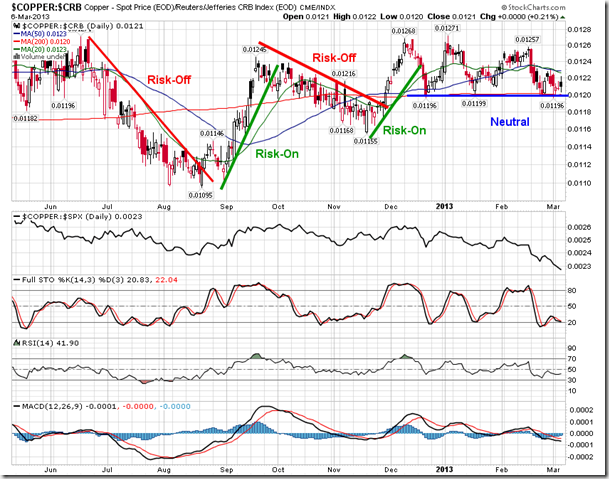
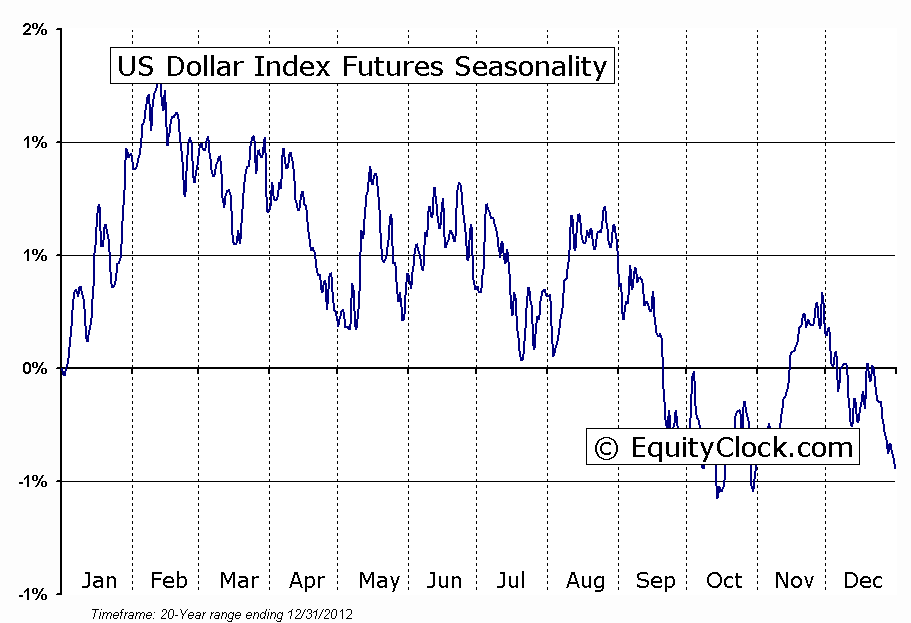
It has been argued amongst a number of analysts that the struggling fundamentals of the worldwide economy is being revealed in the price action of Copper over recent weeks. Copper is seen as an indicator of industrial/manufacturing strength, therefore having leading implications as to the health of the economy. The expectation amongst analysts is that equity markets will eventually reflect the struggling fundamentals that Copper is suggesting. The commodity complex has been beaten up over the past month as a result of strength in the US Dollar, which bounced definitively off a point of long-term support. And although Copper has significantly underperformed equity markets, it has defined a neutral trend relative to other commodity benchmarks, suggesting that the weakness in the price action is no more than that of other commodities. The ratio of Copper relative to the CRB Commodity index has provided reliable risk-on and risk-off signals, however, the neutral trend that has been in place since December fails to provide any conclusive evidence of something that would be perceived as significantly negative for risk assets. Dollar strength seasonally caps out in the present month as first quarter strength concludes.
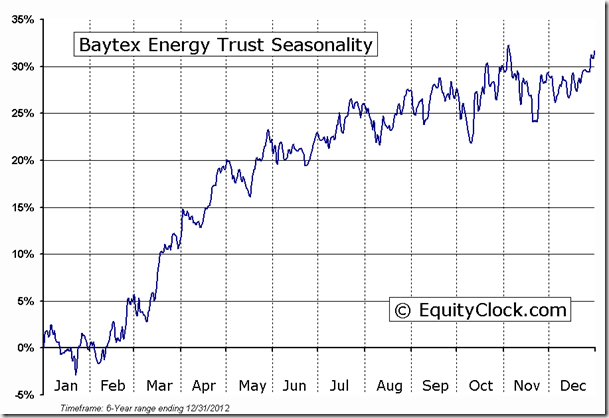
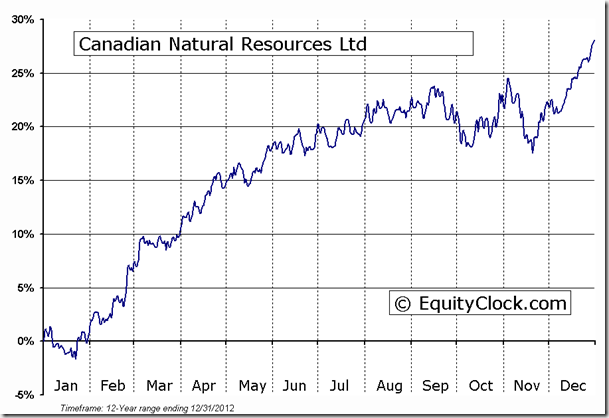
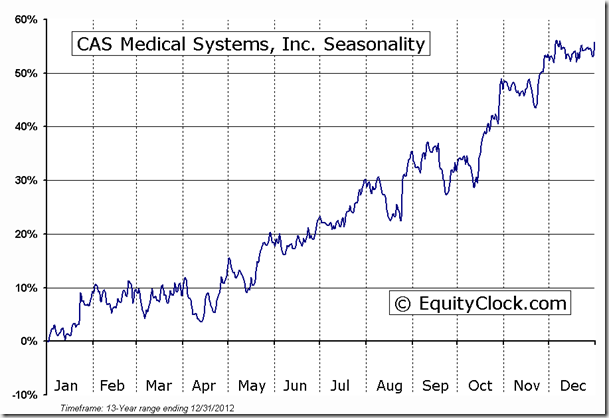
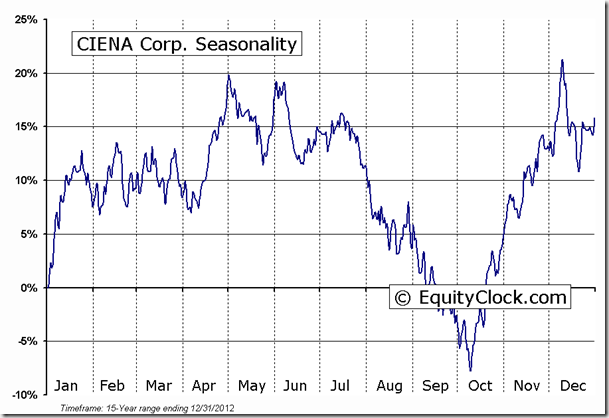
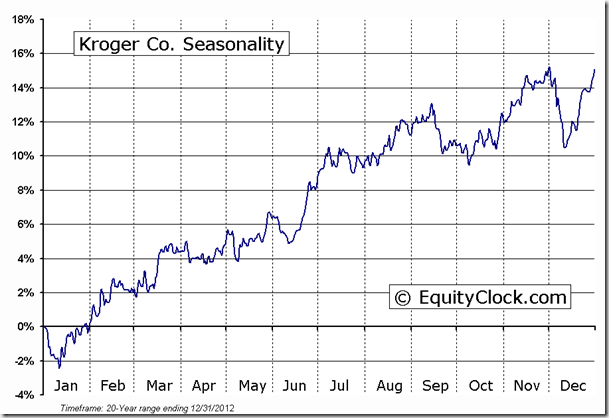
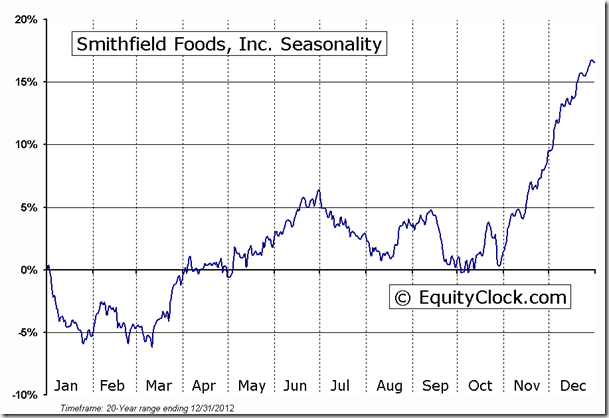
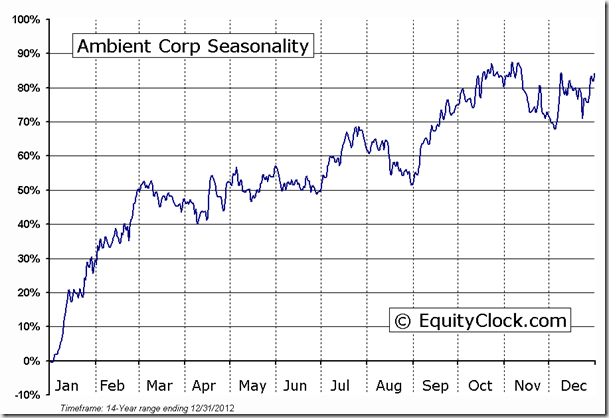
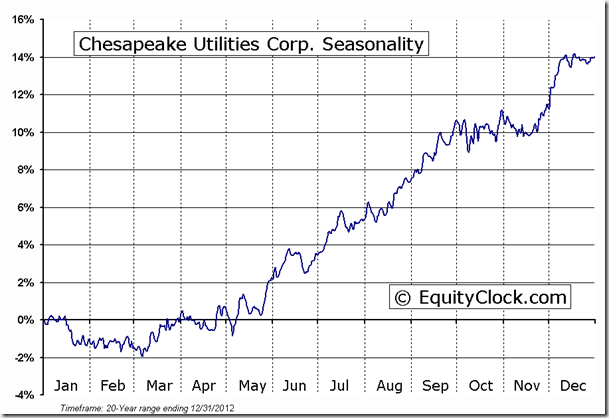
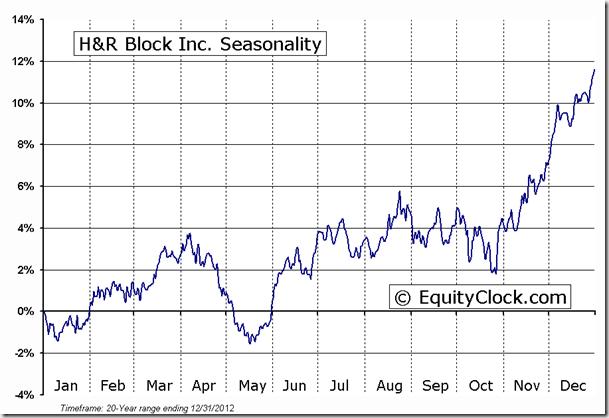
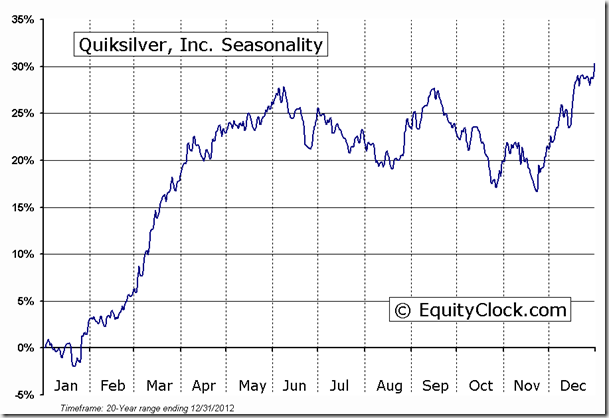
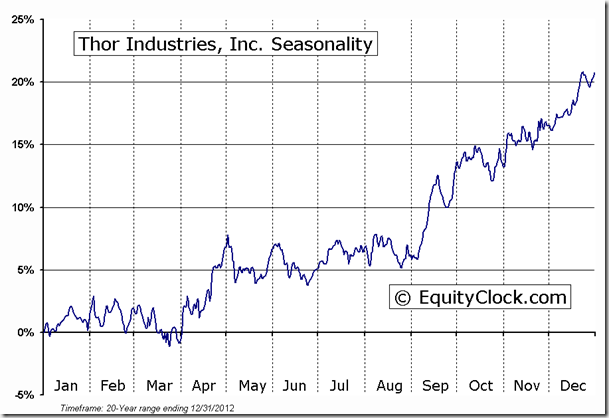
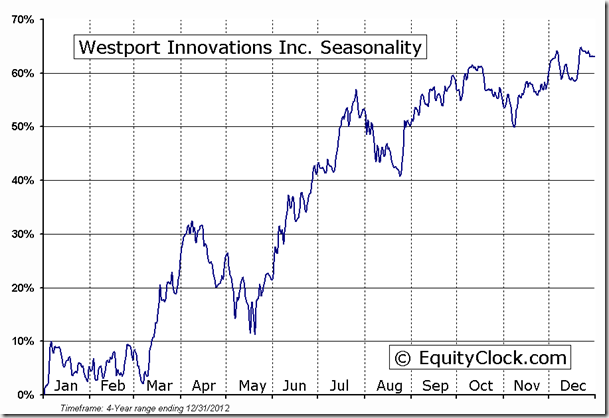
Seasonal charts of companies reporting earrings today are as follows:
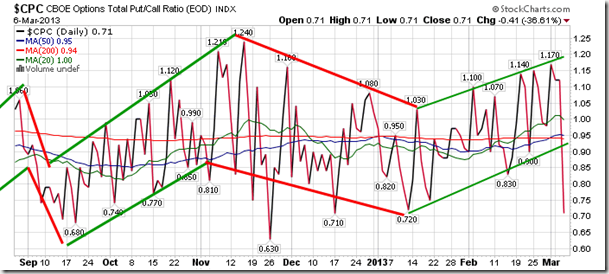
Sentiment on Wednesday, as gauged by the put-call ratio, ended overly bullish at 0.71. The ratio has consistently held above 1 over the past month, suggesting investor pessimism. This proved to be the case on Tuesday, as well, when equity markets were breaking out to new highs. Wednesday’s plunge to the lowest level of the year at 0.71 (from Tuesday’s close of 1.12) is significant, potentially indicating that investors are starting to let their guard down after over a month of being heavily hedged. With options expiration occurring next Friday, investors will be seeking to cover negative bets, offsetting protective puts by purchasing calls. Unfortunately, as protective hedges are alleviated and investor guard is let down, the risk is that equities are now vulnerable to shocks as the urgency to sell upon any weakness increases. Yesterday’s plunge does warrant concern as complacency may become suggested should the ratio continue to hold significantly below 1, implying more calls trading hands than puts.
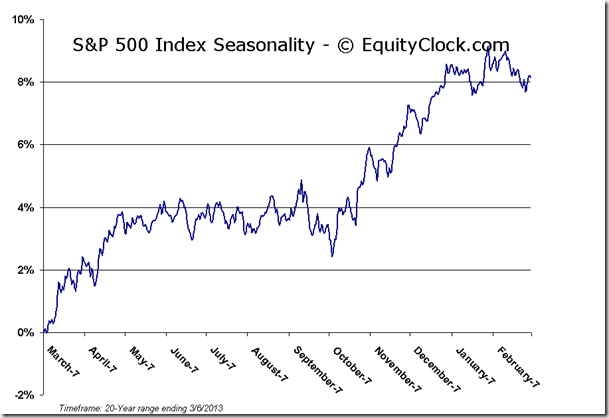
S&P 500 Index
Chart Courtesy of StockCharts.com
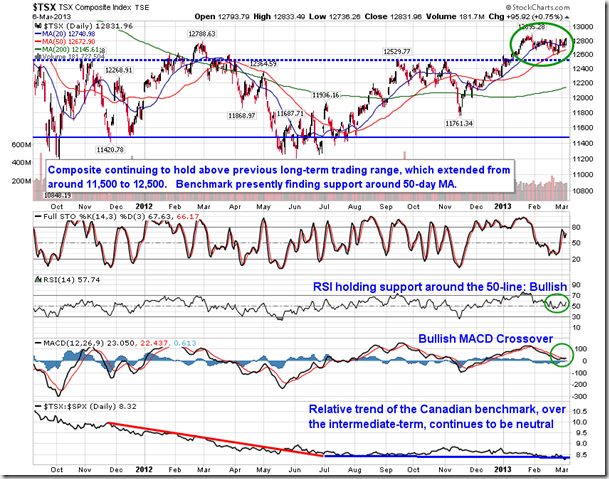
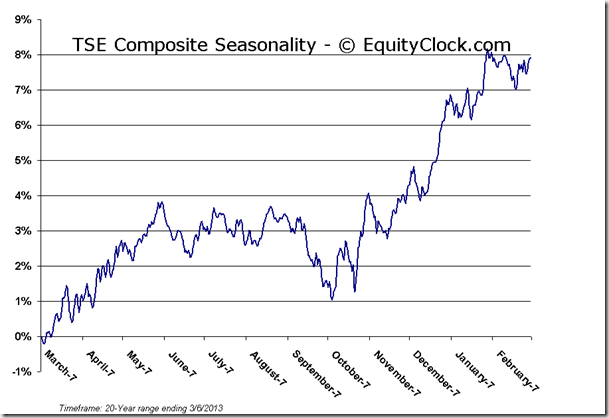
TSE Composite
Chart Courtesy of StockCharts.com
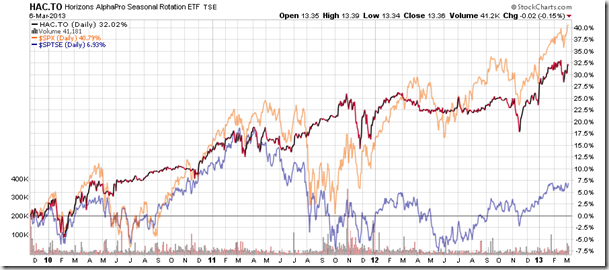
Horizons Seasonal Rotation ETF (TSX:HAC)
- Closing Market Value: $13.36 (down 0.15%)
- Closing NAV/Unit: $13.34 (up 0.10%)
Performance*
| 2013 Year-to-Date | Since Inception (Nov 19, 2009) | |
| HAC.TO | 4.90% | 33.4% |
* performance calculated on Closing NAV/Unit as provided by custodian
Click Here to learn more about the proprietary, seasonal rotation investment strategy developed by research analysts Don Vialoux, Brooke Thackray, and Jon Vialoux.
Copyright © TechTalk


