Pre-opening Comments for Monday March 4th 2013
U.S. equity index futures are lower this morning. S&P 500 futures are down 2 points in pre-opening trade. Index futures are responding to a 3.7% drop by the Shanghai Composite Index last night. The Chinese government has taken steps to dampen real estate speculation.
Yahoo added $0.18 to $22.12 after Barclays upgraded the stock from Equal Weight to Overweight.
Charles Schwab (SCHW $16.40) is expected to open higher after Bernstein upgraded the stock from Market Perform to Outperform.
Sterne Agee launched coverage on the U.S. retail sector. Buy recommendations were allocated to Coach and TJX. Coach added $0.02 to $48.24. TJX improved $0.50 to $45.49.
TransCanada (TRP $47.81) is expected to open higher after the U.S. State Department issued a report suggesting the Keystone pipeline will not increase environmental concerns.
Aurizon (ARZ $4.35) is expected to open higher after receiving a “white knight” offer to purchase the company at approximately $4.75 per share.
UnitedHealth Services slipped $57.94 after WallachBeth downgraded the stock from Buy to Hold.
Bank of American/Merrill adjusted its recommendations on U.S. pharmaceutical stocks. Merck was upgraded from Neutral to Buy. Bristol Myers Squibb was downgraded from Buy to Hold. Merck added $0.29 to $42.92. Bristol Myers slipped $0.24 to $36.91.
Economic News This Week
February ISM Services to be released at 10:00 AM EST on Tuesday is expected to increase to 55.4 from 55.2 in January.
The February ADP Employment Change report to be released at 8:15 AM EST on Wednesday is expected to fall to 150,000 from 192,000 in January
January Factory Orders to be released at 10:00 AM EST on Wednesday is expected to decline 2.2% versus a gain of 1.8% in December.
The Bank of Canada’s Policy Announcement is expected to be released at 10:00 AM EST on Wednesday.
The Federal Reserve’s Beige Book is released at 2:00 PM EST on Wednesday.
Weekly Initial Jobless Claims to be released at 8:30 AM EST on Thursday is expected to increase to 350,000 from 344,000 last week.
Second estimate of fourth quarter Productivity to be released at 8:30 AM EST on Thursday is expected to improve to -1.6% from the initial estimate of -2.0%.
January Canada’s Merchandise Trade Balance to be announced at 8:30 AM EST on Thursday is expected to improve to -$600 million from -901 million in December.
February Canadian Housing Starts to be released at 8:15 AM EST on Friday is expected to slip to 174,000 from 160,600 in January.
February Non-farm Payrolls to be released at 8:30 AM EST on Friday is expected to increase to 165,000 from 157,000 in January. Private Non-farm Payrolls is expected to increase to 178,000 from 166,000 in January. The February Unemployment Rate is expected to remain unchanged at 7.9% set in January. February Hourly Earnings are expected to remain unchanged at 0.2% set in January.
February Canadian Employment to be released at 8:30 AM EST on Friday is expected to increase 8,000 versus a decline of 21,900 in January.
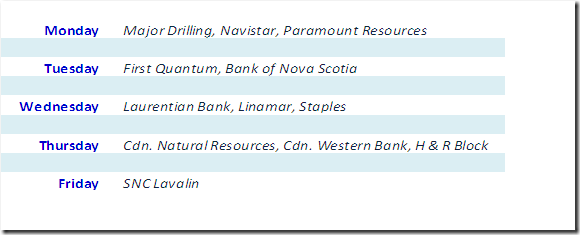
Earnings Reports This Week
Equity Trends
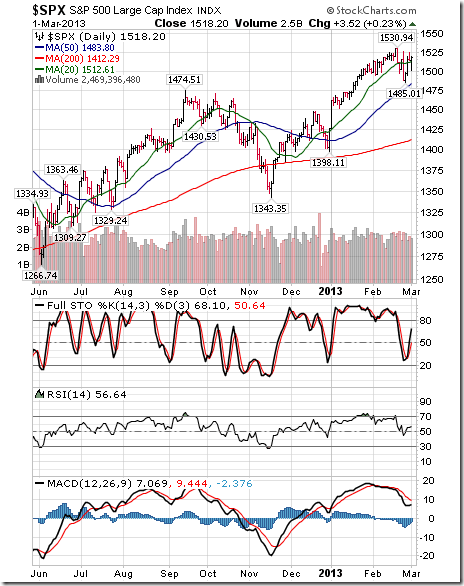
The S&P 500 Index added 2.60 points (0.17%) last week. Intermediate trend is up. Resistance is forming at 1,530.94. The Index remains above its 20, 50 and 200 day moving averages. Short term momentum indicators have declined to a neutral level.
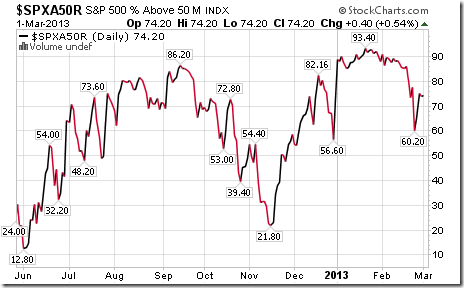
Percent of S&P 500 stocks slipped to 74.20% from 77.40%. Percent is trending down from an intermediate overbought.
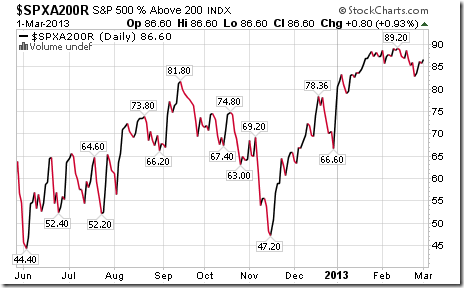
Percent of S&P 500 stocks increased last week to 86.60% from 86.00%. Percent reached an intermediate peak three weeks ago.
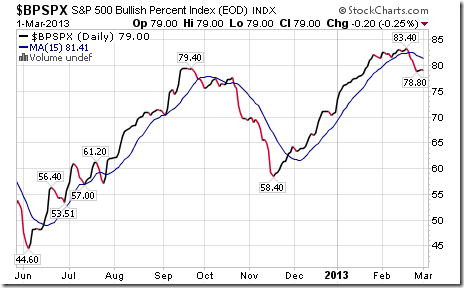
Bullish Percent Index for S&P 500 stocks slipped last week to 79.00% from 81.00% and remained below its 15 day moving average. The Index is intermediate overbought and showing signs of peaking
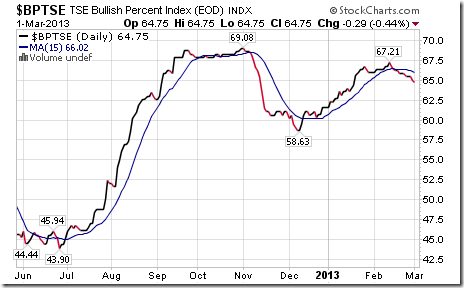
Bullish Percent Index for TSX stocks fell last week to 64.75% from 65.85% and remained below its 15 day moving average. The Index is overbought and showing signs of trending down.
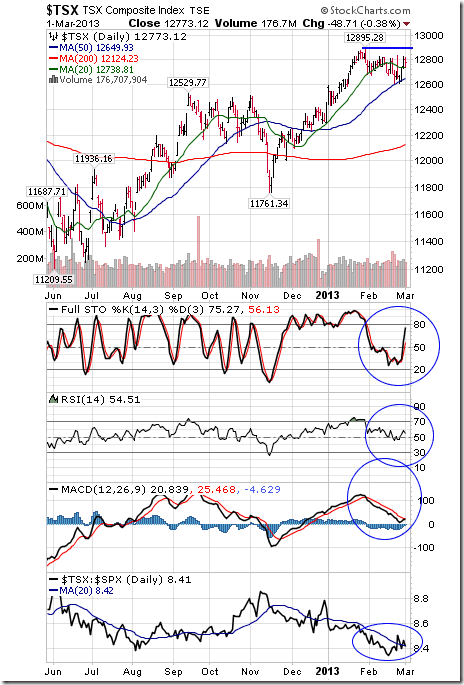
The TSX Composite Index gained 71.49 points (0.56%) last week. Intermediate trend remains down. Resistance is at 12,895.28. The Index remains above its 20, 50 and 200 day moving averages. Strength relative to the S&P 500 Index changed from negative to neutral. Short term momentum indicators have declined to neutral levels.
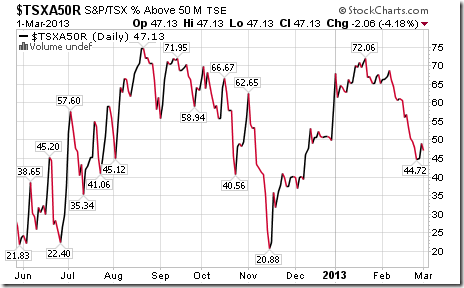
Percent of TSX stocks trading above their 50 day moving average fell last week to 47.13% from 49.59%. Percent continues to trend down from an intermediate overbought.
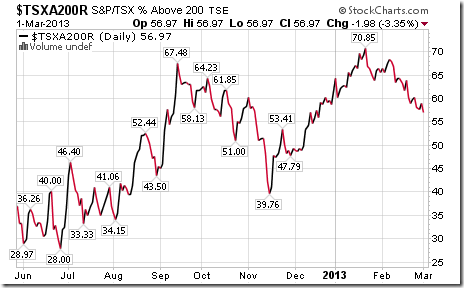
Percent of TSX stocks trading above their 200 day moving average fell to 56.97% from 59.76%. Percent continues to trend down from an intermediate overbought level.
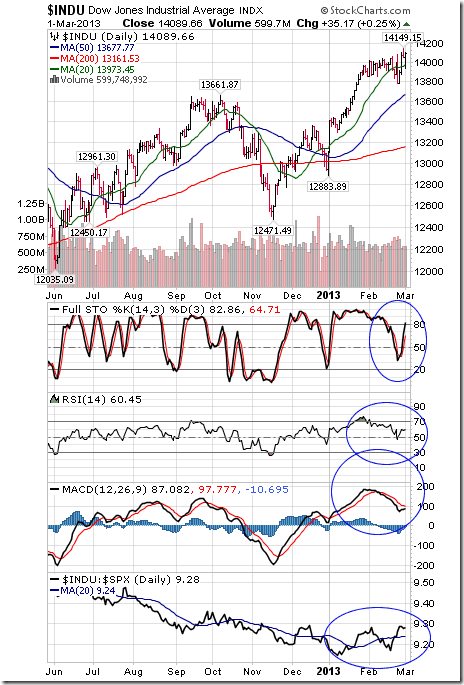
The Dow Jones Industrial Average gained 89.09 points (0.60%) last week. Intermediate uptrend was confirmed when the Average broke to a five year high. The Average remains above its 20, 50 and 200 day moving averages. Strength relative to the S&P 500 Index changed from neutral to positive. Short term momentum indicators have returned to slightly overbought levels.
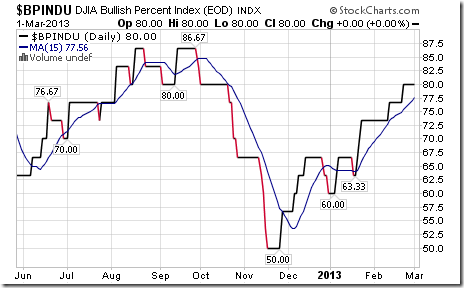
Bullish Percent Index for Dow Jones Industrial Average stocks was unchanged last week at 80.00% and remained above its 15 day moving average. Percent remains intermediate overbought.
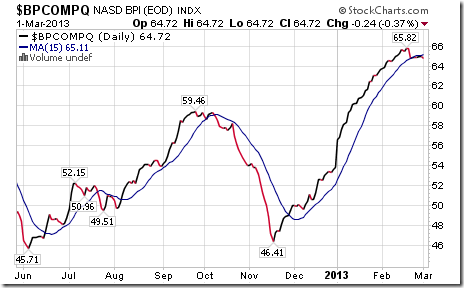
Bullish Percent for NASDAQ Composite stocks slipped last week to 64.72% from 64.87% and dropped below its 15 day moving average. The Index is intermediate overbought and showing early signs of peaking.
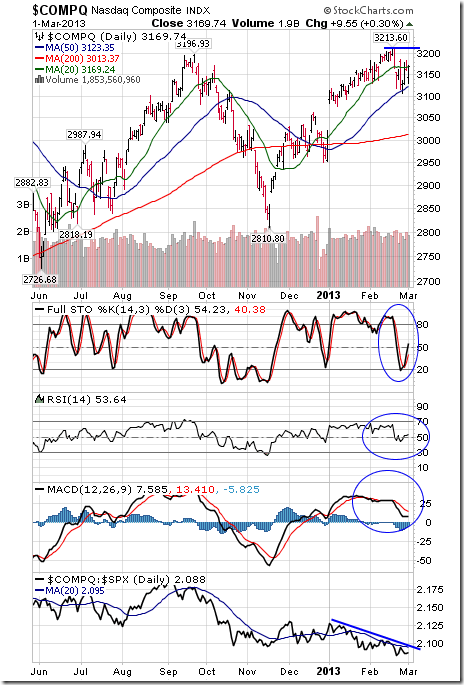
The NASDAQ Composite Index added 7.92 points (0.25%) last week. Intermediate trend is up. The Index moved above its 20 day moving average on Friday. Resistance is forming at 3,213.60. Strength relative to the S&P 500 Index remains negative. Short term momentum indicators have declined to neutral levels.
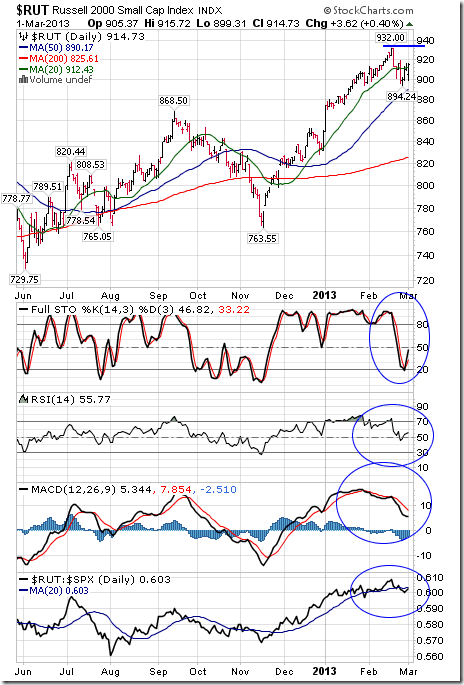
The Russell 2000 Index eased 1.37 points (0.15%) last week. Intermediate trend is forming at 932.00. The Index moved above its 20 day moving average on Friday. Strength relative to the S&P 500 Index remains negative. Short term momentum indicators have declined to a neutral level.
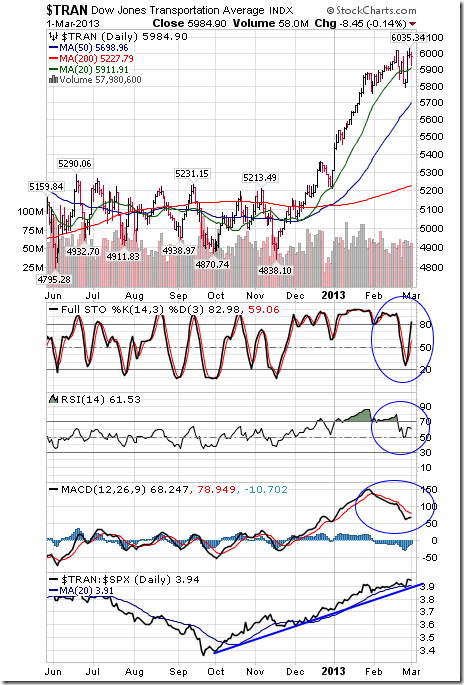
The Dow Jones Transportation Average gained 41.01 points (0.69%) last week. Intermediate uptrend was confirmed on Thursday when the Average reaches an all-time high. The Average remains above its 20, 50 and 200 day moving averages. Strength relative to the S&P 500 Index remains positive. Short term momentum indicators have declined to neutral levels.
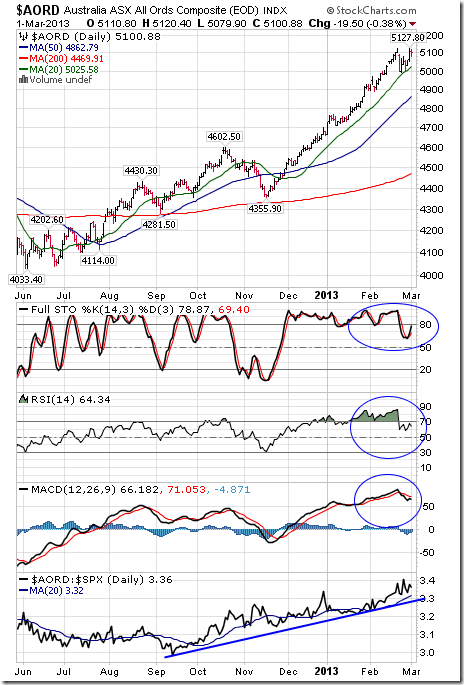
The Australia All Ordinaries Composite Index gained 64.18 points (1.27%) last week. Intermediate trend is up. The Index remains above its 20, 50 and 200 day moving averages. Strength relative to the S&P 500 Index remains positive. Short term momentum indicators are overbought.
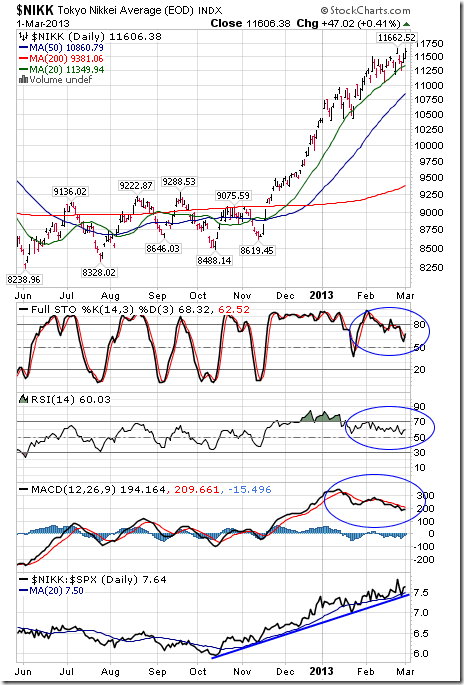
The Nikkei Average gained 220.44 points (1.94%) last week. Intermediate trend is up. The Average remains above its 20, 50 and 200 day moving averages. Strength relative to the S&P 500 Index remains positive. Short term momentum indicators have rolled over from overbought levels.
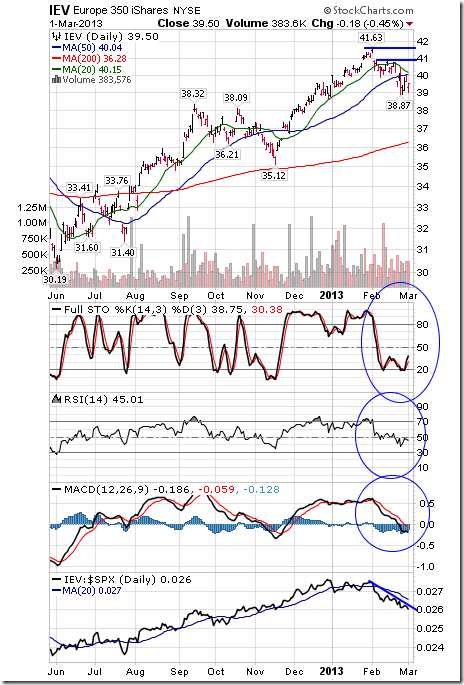
iShares on the Europe 350 Index fell another $0.61 (1.52%) last week. Intermediate trend is down. Units remain below their 20 day moving average and fell below their 50 day moving average. Strength relative to the S&P 500 Index remains negative. Short term momentum indicators are trending down.
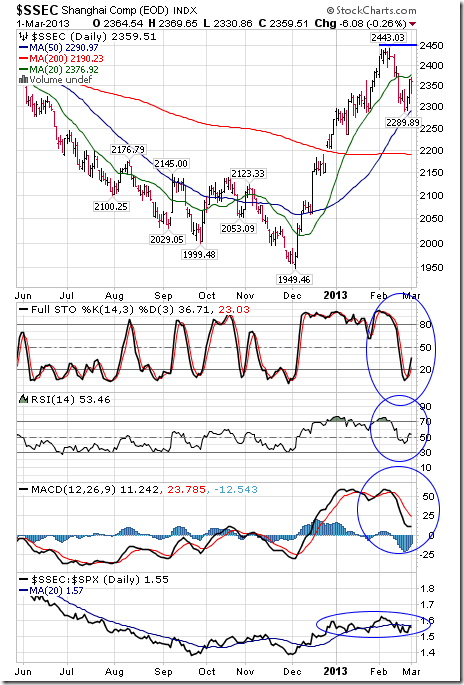
The Shanghai Composite Index gained 45.35 points (1.96%) last week. Intermediate trend is up. Resistance has formed at 2,443.03. The Index remains above its 50 and 200 day moving averages and below its 20 day moving average. Strength relative to the S&P 500 Index remains neutral. Short term momentum indicators have declined to neutral levels.
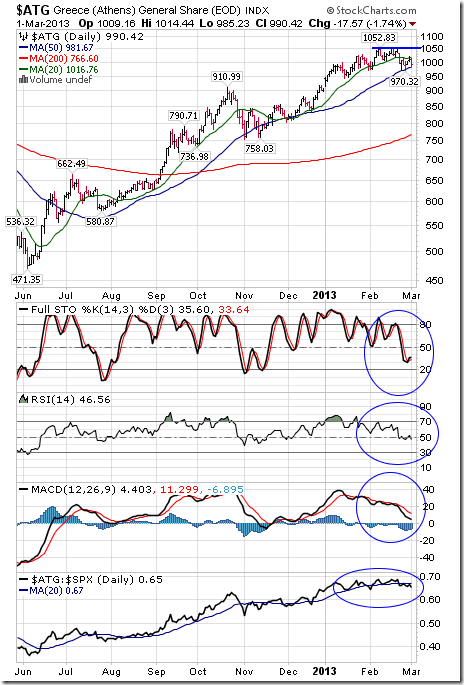
The Athens Index fell 12.90 points (1.52%) last week. Intermediate trend is down. Resistance is at 1,052.83. The Index fell below its 20 day moving average. Strength relative to the S&P 500 Index changed from up to neutral. Short term momentum indicators are trending down.
Currencies
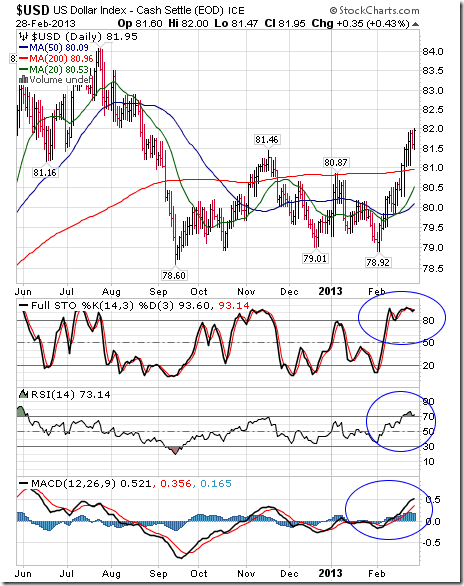
The U.S. Dollar Index gained another 0.47 (0.58%) last week. Intermediate trend remains up. The Index remains above its 20, 50 and 200 day moving averages. Short term momentum indicators are overbought, but have yet to show signs of peaking.
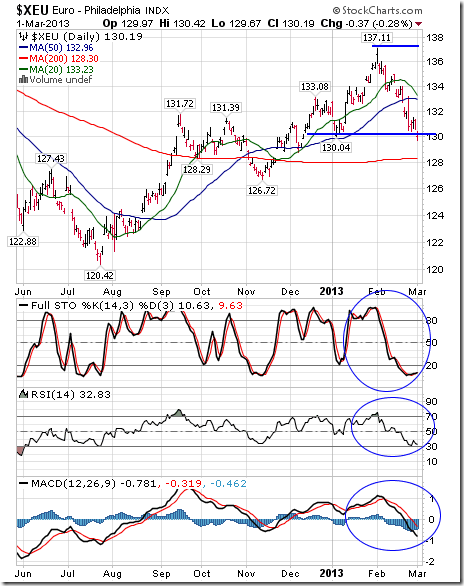
The Euro fell 1.73 (1.31%) last week. Intermediate trend changed from up to neutral on a move below 130.04 on Friday. The Euro remains below its 20 and 50 day moving average and above its 200 day moving average. Short term momentum indicators are oversold, but have yet to show signs of bottoming.
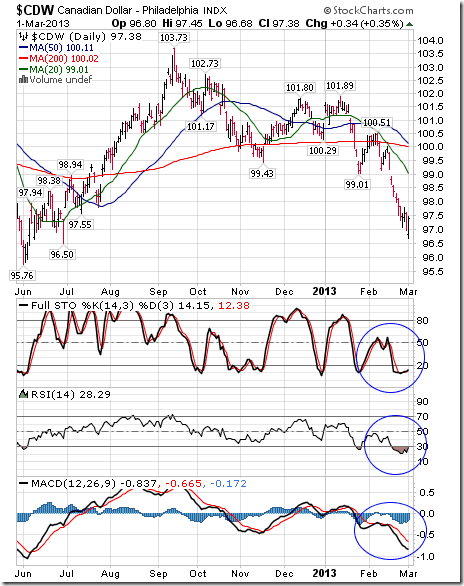
The Canadian Dollar fell another $0.50 U.S. (1.31%) last week. Intermediate trend is down. The Canuck Buck remains below its 20, 50 and 200 day moving averages. Short term momentum indicators are oversold, but have yet to show signs of bottoming.
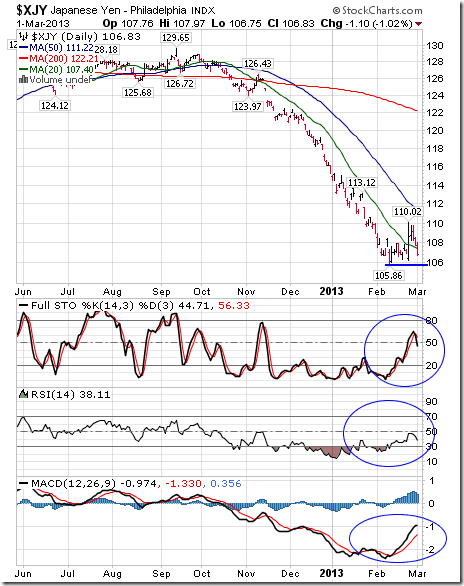
The Japanese Yen slipped 0.27 (0.25%) last week. Intermediate trend is down. Support has formed at 105.86. The Yen remains below its 20, 50 and 200 day moving average. Short term momentum indicators are recovering from oversold levels.
Commodities
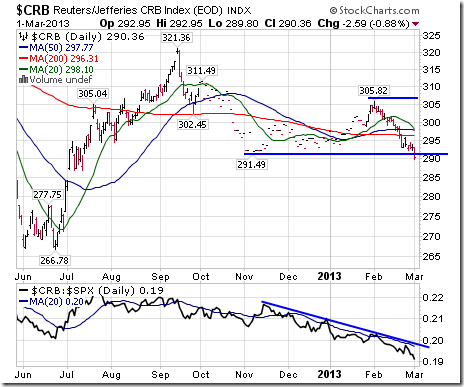
The CRB Index fell another 3.16 points (1.08%) last week. Intermediate trend changed from neutral to down on a break below support at 291.49. The Index remains below its 20, 50 and 200 day moving averages. Strength relative to the S&P 500 Index remains negative.
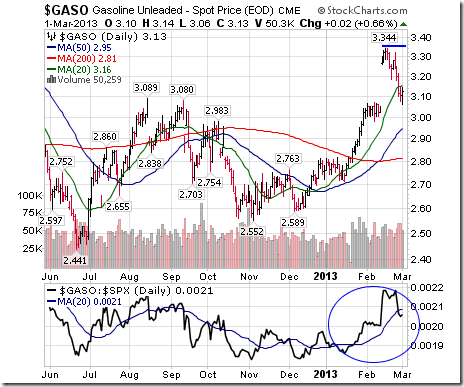
Gasoline fell $0.14 per gallon (4.28%) last week. Intermediate trend is up. Gas fell below its 20 day moving average. Strength relative to the S&P 500 Index changed from up to neutral.
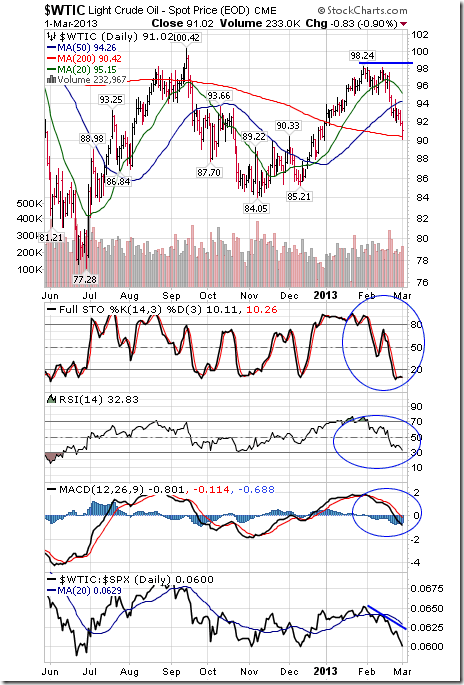
Crude Oil fell another $2.25 (2.41%) last week. Intermediate trend remains down. Crude remains below its 20 and 50 day moving averages. Strength relative to the S&P 500 Index remains negative. Short term momentum indicators continue to trend down.
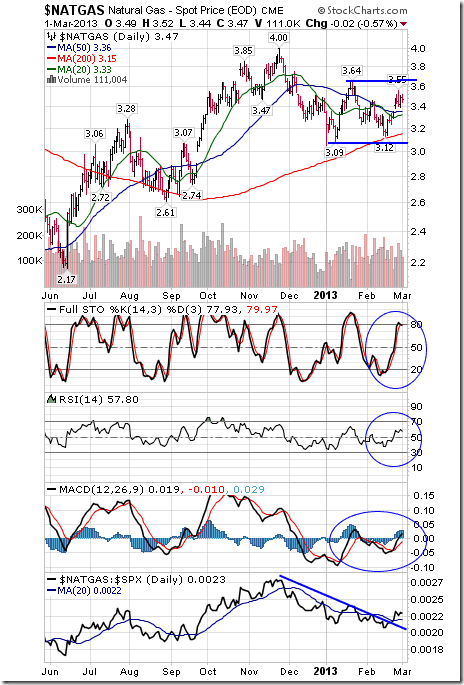
Natural Gas gained $0.16 (4.83%) last week. Intermediate trend remains neutral. Gas moved above its 20 and 50 day moving average. Strength relative to the S&P 500 Index remains neutral. Short term momentum indicators are trending up.
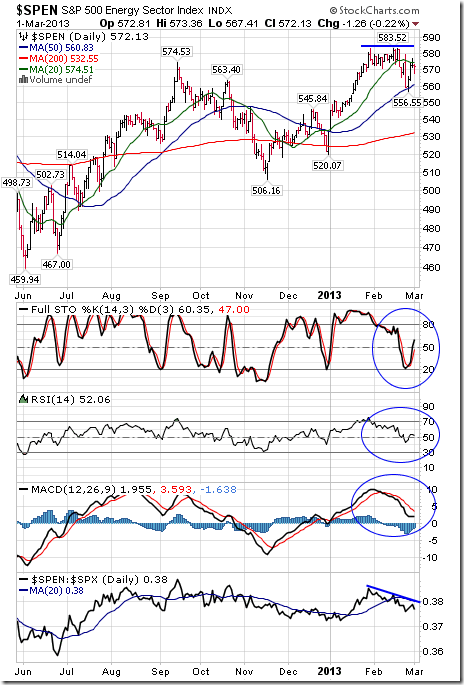
The S&P Energy Index slipped 1.44 (0.25%) last week. Intermediate trend is neutral. Resistance has formed at 583.52. The Index remains above its 50 and 200 day moving averages and below its 20 day moving average. Strength relative to the S&P 500 Index remains negative. Short term momentum indicators have declined to neutral levels.
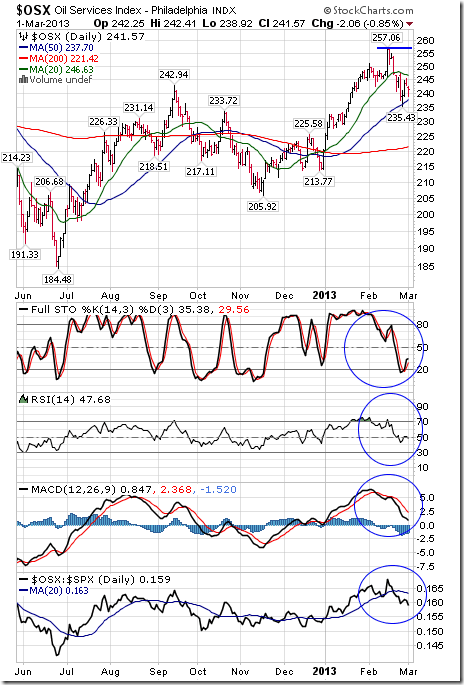
The Philadelphia Oil Services Index fell 4.12 points (1.72%) last week. Intermediate trend remains neutral. The Index remains below its 20 day moving average and above its 50 day moving average. Strength relative to the S&P 500 has changed from neutral to negative. Short term momentum indicators continue to trend down.
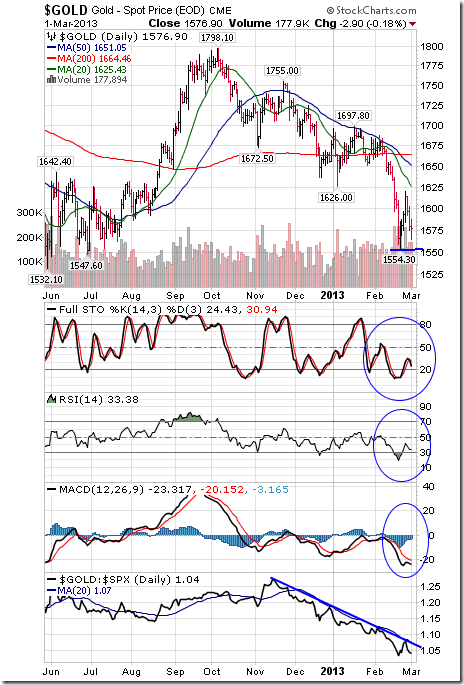
Gold fell $2.50 per ounce (0.17%) last week. Intermediate trend is down. Support is forming at $1,554. 30. Gold remains below its 20, 50 and 200 day moving averages. Strength relative to the S&P 500 Index remains negative. Short term momentum indicators are oversold and showing early signs of bottoming.
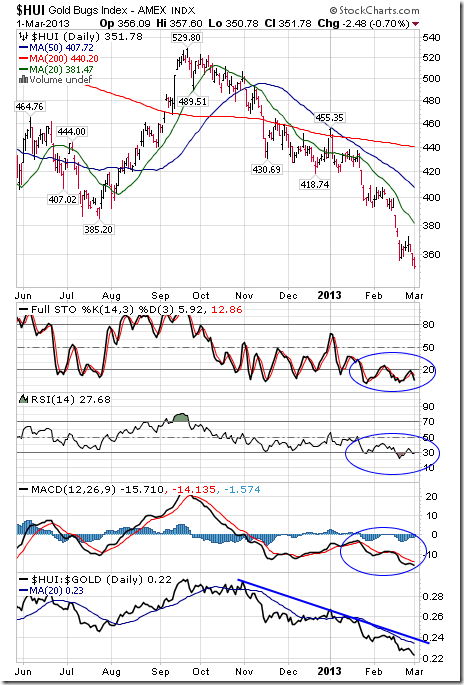
The AMEX Gold Bug Index dropped another 7.85 points (2.18%) last week. Intermediate trend is down. The Index remains below its 20, 50 and 200 day moving averages. Strength relative to gold remains negative. Short term momentum indicators are oversold, but have yet to show signs of bottoming.
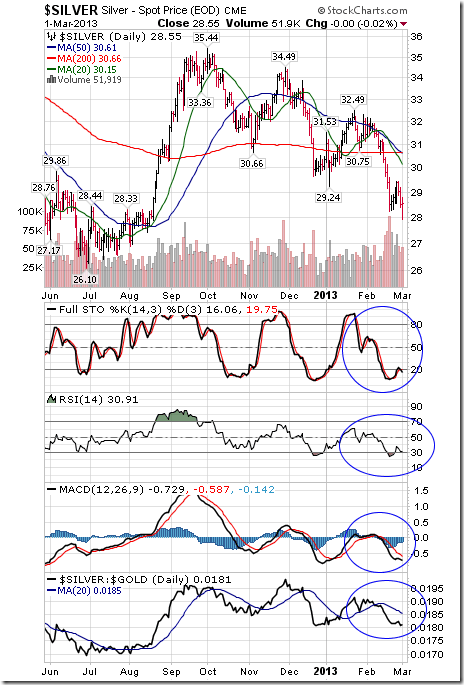
Silver fell another $0.15 per ounce (0.52%) last week. Intermediate trend is down. Silver remains below its 20, 50 and 200 day moving averages. Strength relative to gold remains negative. Short term momentum indicators are oversold, but have yet to show signs of bottoming.
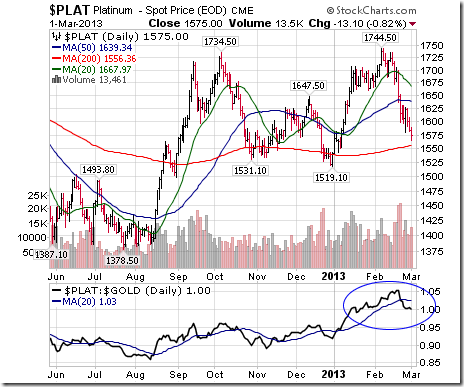
Platinum fell $46.00 per ounce (2.54%) last week. Intermediate trend remains neutral. Platinum remains below its 20 and 50 day MAs. Strength relative to gold remains neutral.
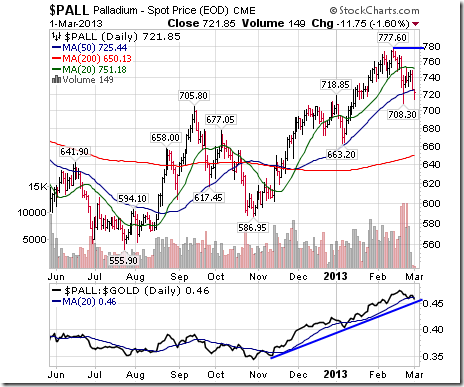
Palladium lost $15.15 per ounce (2.06%) last week. Resistance has formed at $777.60 per ounce. Intermediate trend is up. Palladium remains below its 20 and 50 day moving averages. Strength relative to gold remains positive.
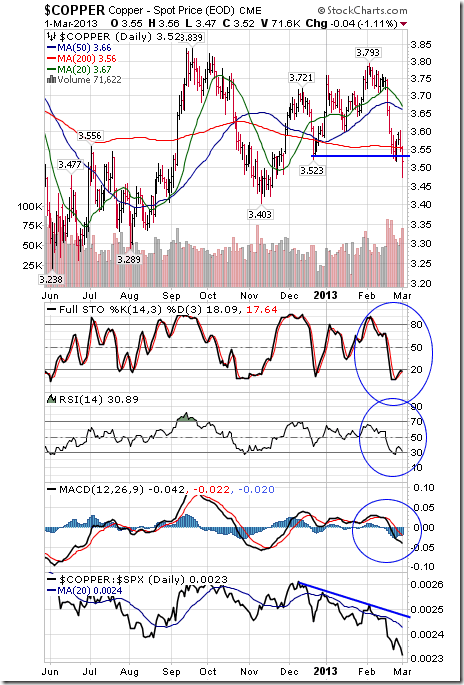
Copper slipped $0.03 per lb. (0.85%) last week. Intermediate trend changed from neutral to negative on a break below $3.523. Copper remains below its 20, 50 and 200 day moving averages. Strength relative to the S&P 500 Index remains negative. Short term momentum indicators are oversold.
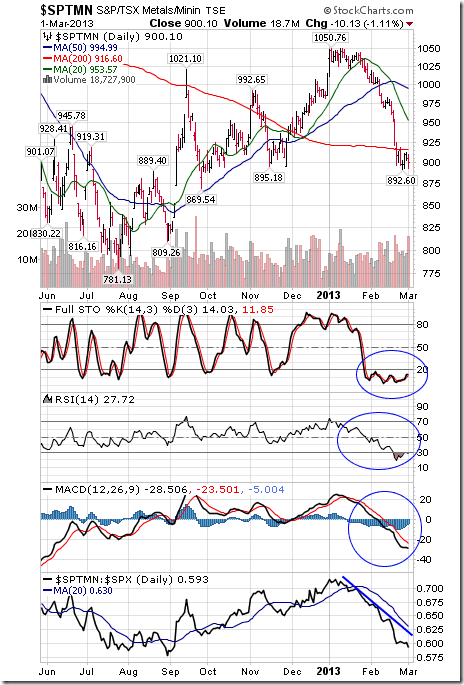
The TSX Metals and Mining Index fell another 11.23 points (1.23%) last week. Intermediate trend is down. The Index remains below its 20, 50 and 200 day moving averages. Strength relative to the S&P 500 Index remains negative. Short term momentum indicators are oversold, but have yet to show signs of bottoming.
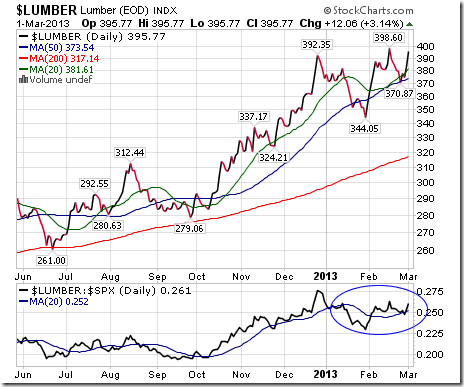
Lumber gained $16.06 (4.23%) last week. Nice bounce from near its 20 and 50 day moving average! Strength relative to the S&P 500 Index changed from neutral to slightly positive.
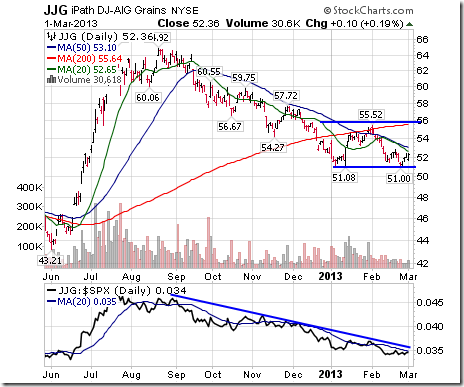
The Grain ETF added $0.72 (1.39%) last week. Intermediate trend changed from neutral to negative on a break below $51.08. Strength relative to the S&P 500 Index remains negative.
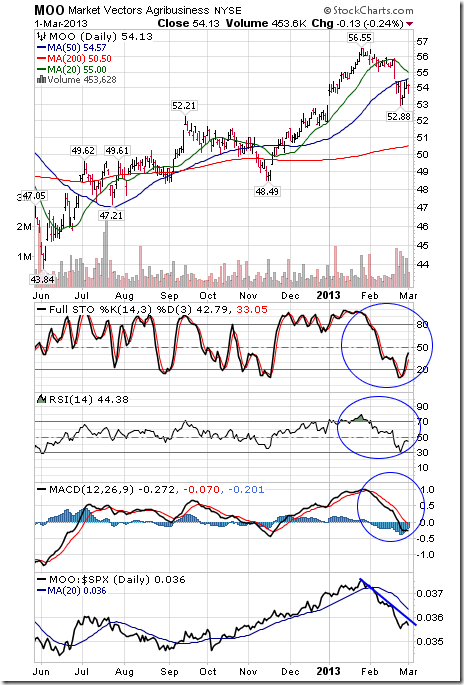
The Agriculture ETF improved $0.03 (0.06%) last week. Intermediate trend is down. Units remain below their 20 and 50 day moving averages. Strength relative to the S&P 500 Index remains negative. Short term momentum indicators are oversold and showing early signs of bottoming.
Interest Rates
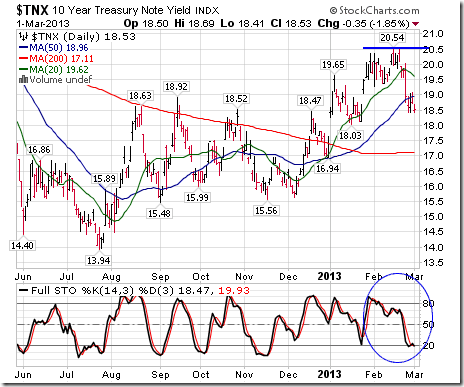
The yield on 10 year Treasuries fell 10.5 basis points (5.36%) last week. Yield fell remains below its 20 day moving average and fell below its 50 day moving average. Short term momentum indicators are trending down.
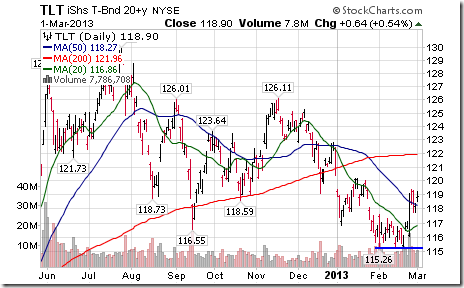
Conversely, price of the long term Treasury ETF gained $1.97 (1.60%) last week. Price remains above its 20 day moving average and moved above its 50 day moving average. Support has formed at $115.26
Other Issues
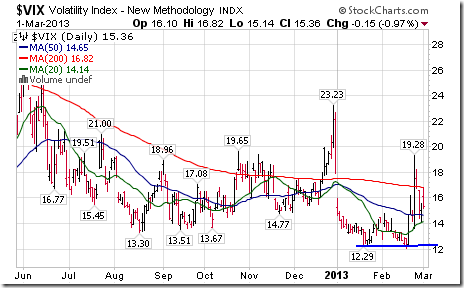
The VIX Index added 0.19 (0.84%) last week. Support is at 12.29%
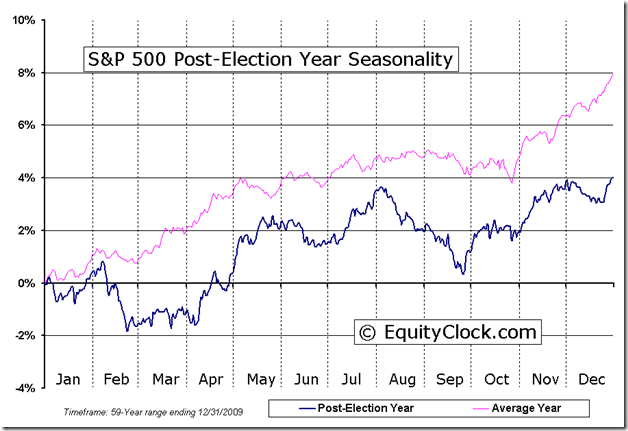
With the exception of the Dow Jones Industrial Average and the Dow Jones Transportation Average which moved to new highs last week, most equity indices and sectors peaked between January 30th and February 20th. The peak coincides with average performance by the S&P 500 Index in a post-election year. History suggest that a shallow correction in equity markets has started that likely will last until the end of March/first week in April
More evidence of shallow correction! Economic data released this week generally will show a slowdown in economic growth in the month of February
Earnings reports this week are not expected to have a significant impact on equity prices
Political influences on equity markets are diminished this week. Congress is on holidays. The next critical date is March 27th when a continuing resolution needs approval by Congress.
Short and intermediate technical indicators continue to show that at least a short term peak has been reached by most equity markets and sectors.
Cash hoards remain high, but are declining as companies announce dividend increases and share buybacks instead of capital spending.
The Bottom Line
A shallow correction between now and the end of March will provide an opportunity to accumulate sectors on weakness that have a history of outperformance into spring. Sectors on the radar screen include energy, retail, steel and auto & auto parts
The latest weekly update on ETFs in Canada to March 1st is available at
Tom Rogers’ Weekly Elliott Wave Blog
Following is a link:
http://www.tomrogers.net/signpost.htm
Special Free Services available through www.equityclock.com
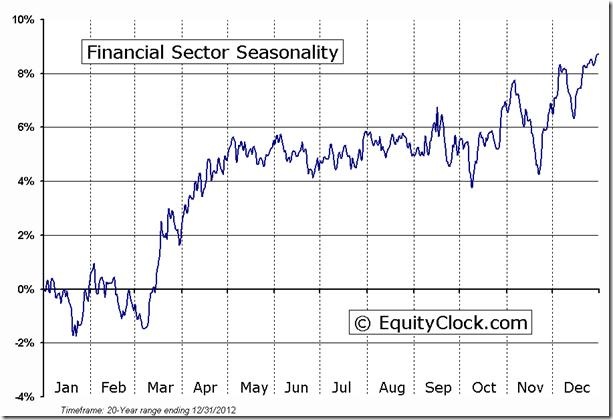
Equityclock.com is offering free access to a data base showing seasonal studies on individual stocks and sectors. The data base holds seasonality studies on over 1000 big and moderate cap securities and indices. Notice that most of the seasonality charts have been updated recently.
To login, simply go to http://www.equityclock.com/charts/
Following is an example:
Financial Sector Seasonal Chart
FINANCIAL Relative to the S&P 500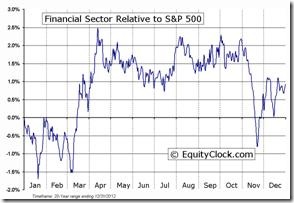 |
Disclaimer: Comments and opinions offered in this report at www.timingthemarket.ca are for information only. They should not be considered as advice to purchase or to sell mentioned securities. Data offered in this report is believed to be accurate, but is not guaranteed.
Don and Jon Vialoux are research analysts for Horizons Investment Management Inc. All of the views expressed herein are the personal views of the authors and are not necessarily the views of Horizons Investment Management Inc., although any of the recommendations found herein may be reflected in positions or transactions in the various client portfolios managed by Horizons Investment Management Inc
Horizons Seasonal Rotation ETF HAC March 1st 2013


![clip_image002[7] clip_image002[7]](https://advisoranalyst.com/wp-content/uploads/HLIC/f322f588ed293a547d94515eca90a056.png)
![clip_image002[5] clip_image002[5]](https://advisoranalyst.com/wp-content/uploads/HLIC/a30f73029bed07fd0b0d72daabcc7476.png)


