


Guest Contribution by Short Side of Long
I received an email from a friend this week, which outlined all the technical reasons as to why the Nasdaq 100, the leader of the current bull market, looks weak and could correct on the downside. I agreed with him. Now, before I continue - it is worth stating that my personal opinion on technical analysis is iffy at best. Having said that, if used correctly in conjunction with fundamentals, sentiment and a variety of other indicators, charts definitely have their place in an investor's tool box (and on my blog).
Chart 1: Nasdaq is suffering from a loss of momentum...

Source: Objective Trader
The email included a chart, shown above, which entertains the idea that the technology sector is suffering from a loss of bullish momentum. Firstly, it is worth noting that the price itself seems to be in the process of printing a first lower high. Moreover, all types of technical indicators are negatively diverging from the price right now, as my technician friend stated. Both of these technical signals could be indicating lower prices are ahead.
Furthermore, let us not forget that the Nasdaq 100 has achieved superb gains out of the March 2009 lows (over 180%) and has lead the way in the current four year bull market. Therefore, to see a leading sector fail in its new bull market high confirmation, should be a worrying sign.
Chart 2: ... and could be ready for a bear market correction!

Source: Short Side of Long
Moving away from all the technical indicators and just focusing on the price itself, one could assume that eventually the Nasdaq is up for a major correction. While the tough part would be to pin point the exact top (as it always is), it is interesting that the Nasdaq 100 has not suffered a negative annual return for four years now. The longer this phenomena goes on, the stronger the mean reversion and correction will eventually be. After all, cyclical bull markets do not last forever.
Looking at the chart above, major corrections and bear markets have usually occurred as prices break major uptrends. This occurred in 2000, 2008 and could be occurring once again in the not so distant future. If the technical indicators above are right (and that remains to be seen), the Nasdaq could complete a triple top around these levels (some like to call it a head & shoulders) and break below the uptrend line - entering a bear market.
Chart 3: Advisors are recommending EXTREME net long exposure

Source: SentimenTrader
What I find even more intriguing than all the technical mumbo jumbo I just wrote about, is that just about everyone is not expecting the outcome laid out in this post. Mark Hulbert runs a great service called Financial Digest, which tracks the opinions and recommendations of various newsletter advisors for the Nasdaq. Just like any other contrarian indicator, when the Hulbert Nasdaq Sentiment shows the majority of "gurus" holding net short exposure it usually means its the time to buy and visa versa. Chart 3 shows that the current readings were above 90% net long exposure, which is one of the most bullish readings since March 2000 (the month the Tech Stock bubble burst). With just about everyone positioning themselves for higher prices, what could possibly go wrong? It is truly rare to find anyone out there expecting a bear market, that is for sure.
Chart 4: Retail investor cash levels are very low...
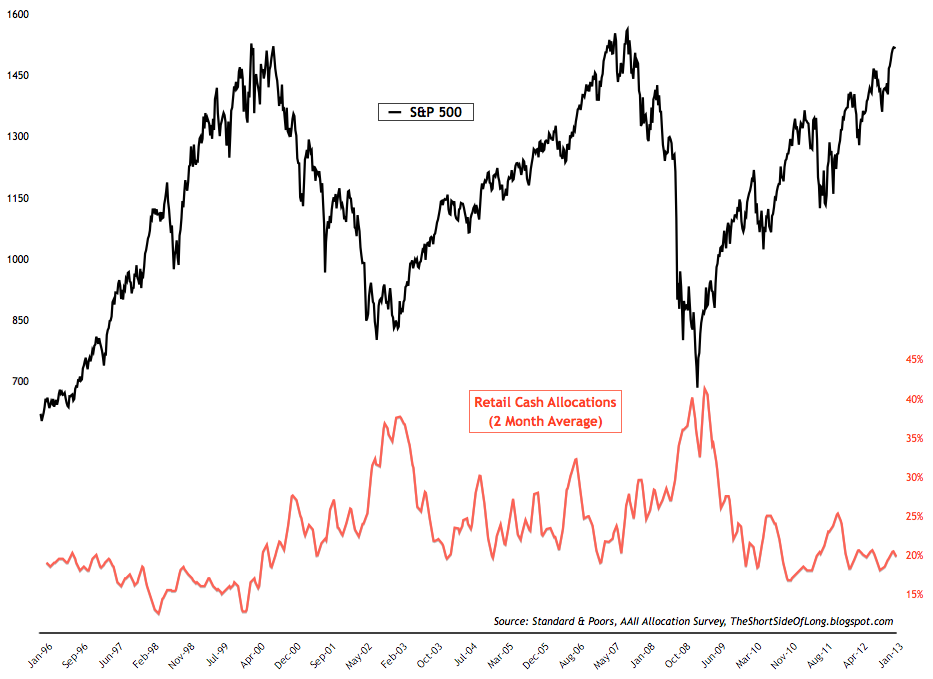
Source: Short Side of Long
In general, I have been concerned about the profit margins and corporate earnings of the overall US market since August of last year, but so far the market is still not concerned. But I am slowly noticing that what I envisioned coming is also becoming more and more obvious to other smart investors. I was recently reading a Bloomberg article, where a great investor by the name of David Einhorn started cutting longs and increasing shorts as the markets rally euphorically during an anaemic economy and stalling earnings growth. He too must think we are becoming quite overvalued right here.
Chart 5: ...while retail inflows into equity funds are very high!

Source: Short Side of Long
Obviously there are many great investors who still remain bullish as well, but I tend to believe they are siding with the wall of retail hot money that is currently chasing the stock market higher. In general, it is almost always better not to side with the retail crowd, as this group of investors has awful timing and a poor decision making process. Therefore, looking at the ongoing very low cash levels (Chart 4) and recent very high inflows into equities (Chart 5), I continue to remain bearish on equities in general. I assume that when something goes wrong in the not so distant future, these same retail investors will be the first to liquidate.
Chart 6: Risk On trade is showing signs of non-confirmation

Source: Short Side of Long

Source: Short Side of Long
Also on my radar is an interesting development in the overall Risk On trade. Infamous poster boys of the risky assets tend to be Copper and Aussie Dollar, with a prime link towards the Chinese economic activity. The fact that neither of these assets have made new highs since at least middle of 2011 should be very concerning. It also tells us that not all is well in China, despite the constant blabbering on various media outlets on how China is booming. Also, consider the fact that both of these assets (Copper and Aussie Dollar) remain in a very tight trading range for several months now. In other words, a break in either direction of these assets could be a major decision for the overall market conditions. While we should let the price decide the next direction, personally I would not be surprised to see a breakdown.
The Bottom Line
Nasdaq is not confirming the broader US index, as it suffers from the loss of momentum and displays a variety of technical divergence signals. The fact that this sector lead the bull market for almost 4 years could be a signal that we are switching over into an eventual downtrend. Sentiment on tech stocks remains EXTREMELY bullish and on parallel with the Tech mania. Finally, Nasdaq is not the only risky asset displaying non-conformations, with Copper and the Aussie struggling to advance for several months now.