by Don Vialoux, Tech Talk
Pre-opening Comments for Friday February 22nd
U.S. equity index futures are higher this morning. S&P 500 futures are up 8 points in pre-opening trade. Equity Index futures are responding to better than expected fiscal second quarter results by Hewlett Packard. Hewlett Packard also was upgraded by UBS from Sell to Hold. The stock gained$0.64 to $17.74 in pre-opening trade.
The Canadian Dollar dropped 0.34 cents U.S. following release of economic news. Consensus for January Consumer Prices was an increase of 0.2%. Actual was an increase of 0.1%. Consensus for December Retail Sales was a decline of 0.3% from November. Actual was a drop of 2.1%.
Dahlman Rose downgraded the fertilizer sector. CF Industries was dropped from Buy to Sell, Agrium was downgraded from Buy to Sell, Mosaic was lowered from Buy to Hold, Potash Corp was dropped from Hold to Sell and Rentech Nitrogen was dropped from Buy to Hold.
Home Depot added $0.82 to $65.20 after Oppenheimer upgraded the stock from Perform to Outperform.
Morgan Stanley gained $0.37 to $23.20 after HSBC upgraded the stock from Underweight to Neutral.
Blackberry eased $0.08 to $13.80 after MKM Partners downgraded the stock from Neutral to Sell.
Yamana Gold (AUY US$15.15) is expected to open higher after HSBC upgraded the stock from Neutral to Overweight.
Caterpillar improved $1.47 to $93.00 after Raymond James upgraded the stock from Market Perform to Outperform.
Chevron gained $0.74 to $115.73 after Canaccord initiated coverage with a Buy rating.
Technical Watch
Hewlett Packard (NYSE:HPQ) – $17.74 added 3.7% after reporting higher than consensus fiscal second quarter revenues and earnings. The stock has a positive technical profile. Intermediate uptrend was confirmed overnight on a break above resistance at $17.45. The stock trades above its 20 and 50 day moving averages and moves above its 200 day moving average at the opening. Strength relative to the S&P 500 Index has been positive since mid-November. Short term momentum indicators are overbought. Preferred strategy is to accumulate the stock at current or lower prices.
Interesting Charts
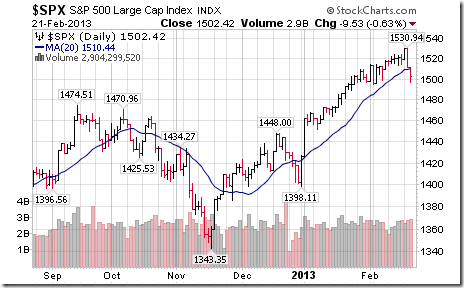
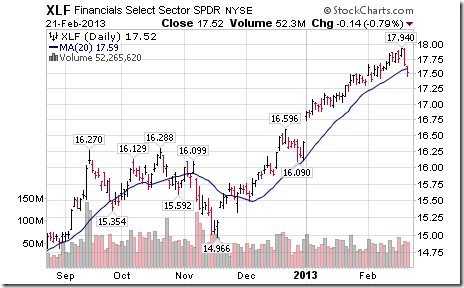
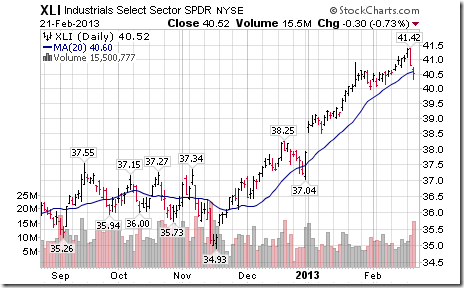
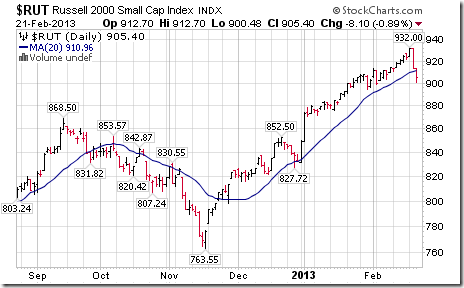
More technical evidence of an intermediate correction has appeared:
The S&P 500 Index closed below its 20 day moving average.
Ditto for the Financial SPDRs!
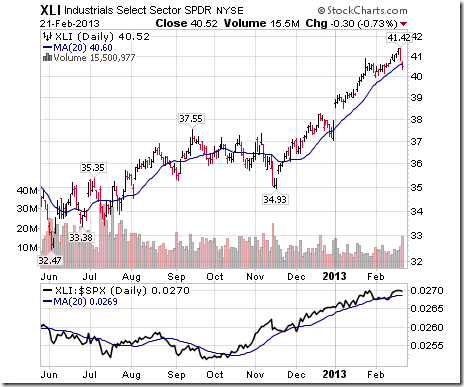
Ditto for the Industrial SPDRs!
Ditto for the Russell 2000!
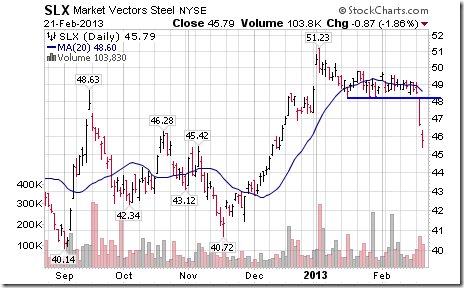
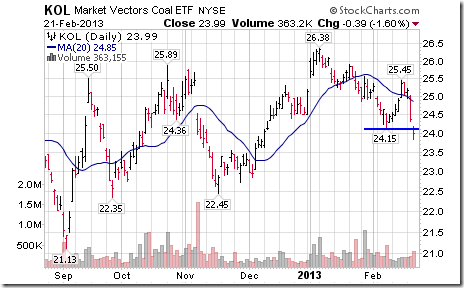
Cyclical stocks and their related ETFs were notably weaker
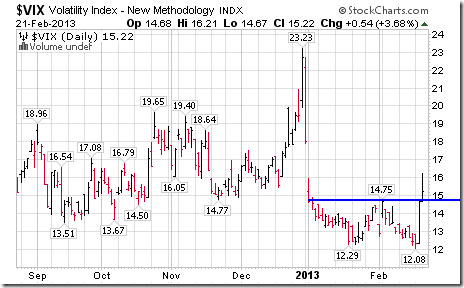
The VIX Index (better known as the “fear” index) spiked.
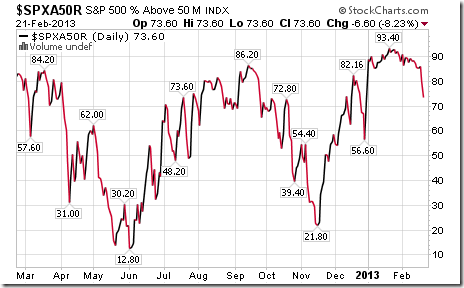
Percent of S&P 500 stocks trading above their 50 day moving average broke decisively below the 80% level, a frequent indicator for a start of an intermediate correction.
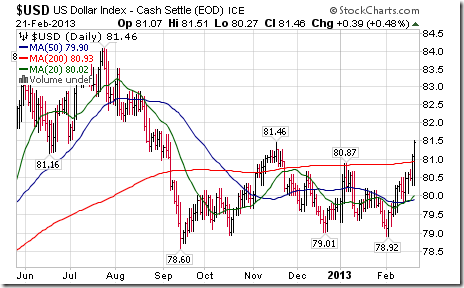
Strength in the U.S. Dollar continues to weigh on equity markets (particularly commodity prices)
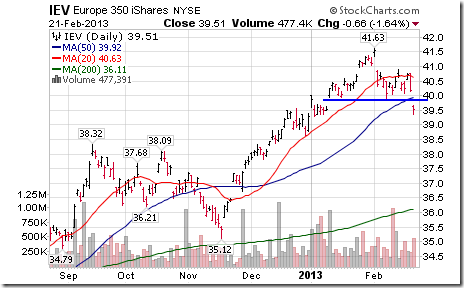
Overnight weakness was triggered by weakness in European equity markets. iShares on the Europe 350 Index completed a short term head and shoulders pattern.
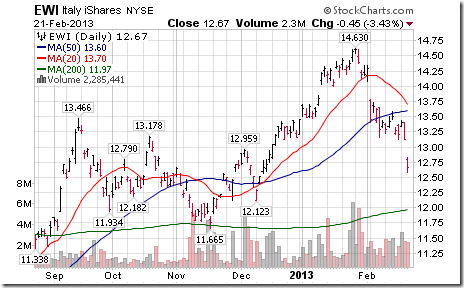
Weakness in European equity markets was notable in Italy prior to the Italian election.
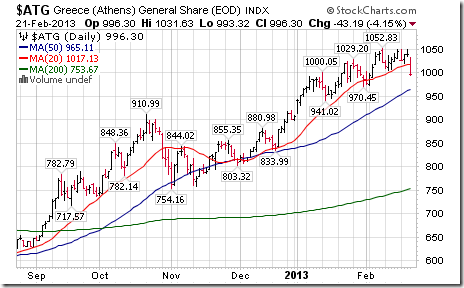
Also notably weaker in Europe was the Athens Index following another march on Greece’s parliament buildings.
FP Trading Desk Headlines
FP Trading Desk headline reads, “Gartman says it’s time to sell stocks after tectonic shift in markets”. Following is a link to the report:
FP Trading Desk headline reads, “Why Gold has further to fall”. Following is a link to the report:
http://business.financialpost.com/2013/02/21/why-gold-has-further-to-fall/
Thackray’s 2013 Investor’s Guide
Thackray’s 2013 Investor’s guide is available by ordering through www.alphamountain.com , Amazon or Books on Business.
Updates on Sector Seasonal Trades
Seasonal trades optimally have a technical score of3 based on (1) uptrend. (2) trading above its 20 day moving average and (3) outperforming the market (S&P 500 for U.S. holdings, TSX for Canadian holdings). Scores moving lower than 3 are warning signs. A score of 0=0.5 is a sell signal.
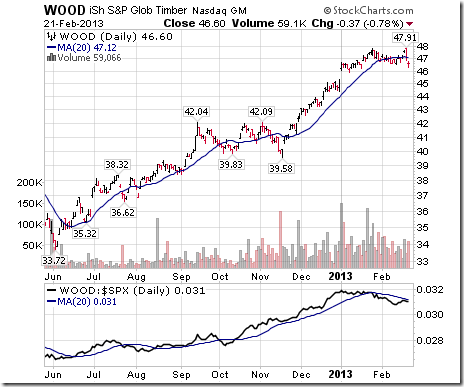
Technical score for the forest product sector changed from 1.0 to 0.0 on a break below support at $46.55 and completed a double top pattern.
Technical score for Industrial SPDRs changed from 3.0 to 2.0 after units fell below their 20 day moving average. Seasonal influences are positive until May.
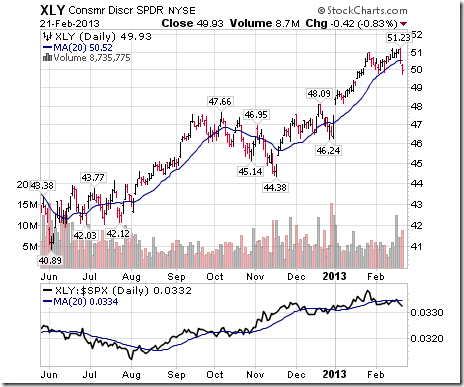
Technical score for the Consumer Discretionary SPDRs changed from 2.5 to 1.0 when units moved below support at $48.78 and below its 20 day moving average. Seasonal influences are positive until mid-April.
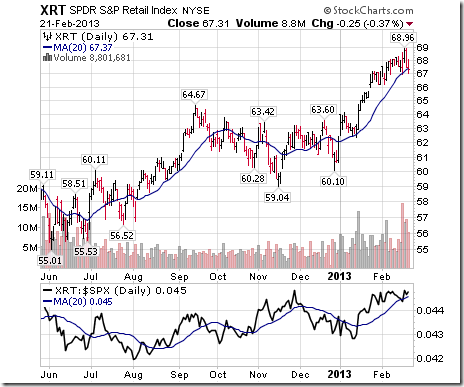
Technical score for Retail SPDRs changed from 3.0 to 2.0 when units moved below their 20 day moving average. Seasonal influences are positive until mid-April.
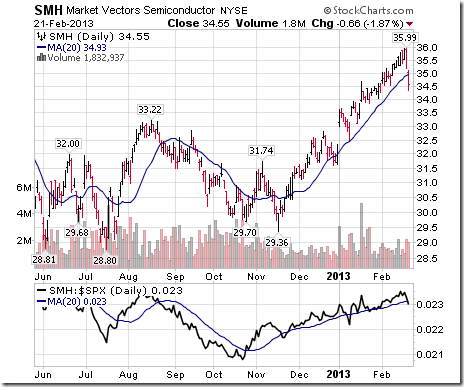
Technical score for the Semiconductor ETF changed from 3.0 to 1.5 when units fell below their 20 day moving average and when strength relative to the S&P 500 Index turned from positive to neutral. Seasonal influences are positive until the first week in March.
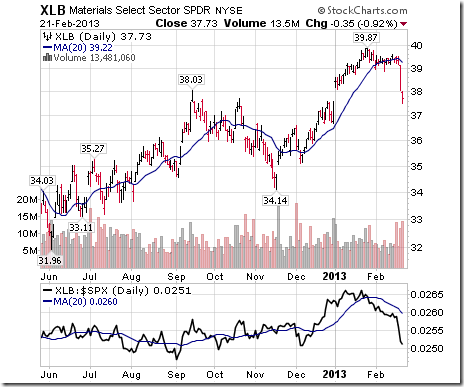
Technical score for Materials SPDRs changed from 1.0 to 0.0 on break below support at $38.86.
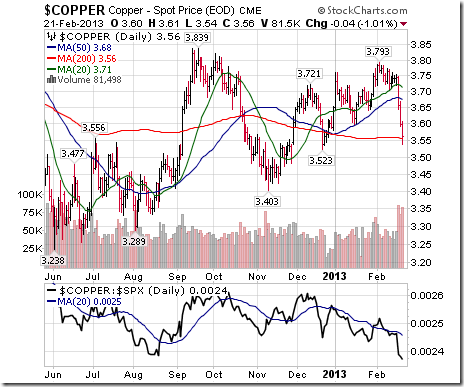
Technical score for copper changed from 2.5 to 0.5 when futures broke below its 20 day moving average, briefly broke support at $3.60, dropped below its 20 day moving average and turned from neutral to negative relative to the S&P 500 Index.
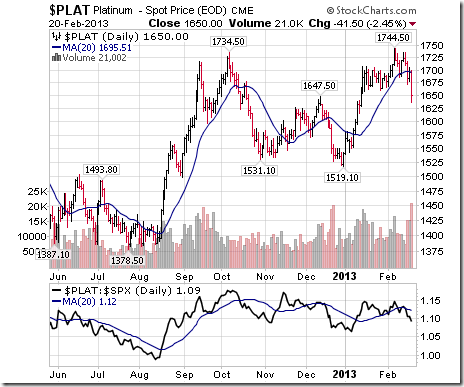
Technical score for Platinum changed from 3.0 to 0.5 when futures fell below their 20 day moving average, broke below support at $1659.70 and turned from positive to negative relative to the S&P 500 Index
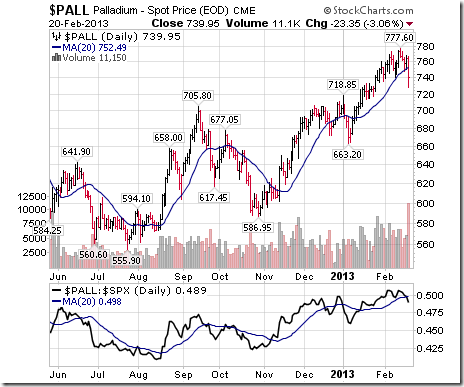
Technical score for Palladium fell from 3.0 to 1.0 when futures fell below their 20 day moving average and strength relative to the S&P 500 changed from positive to neutral.
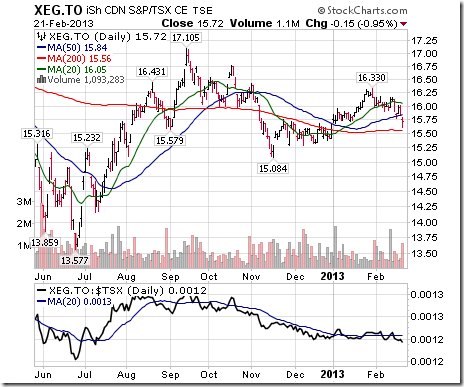
Technical score for iShares on the TSX Energy Index changed from 1.5 to 0.5 after trend changed from positive to neutral on a break below $15.72 and strength relative to the TSX Composite changed from neutral to negative.
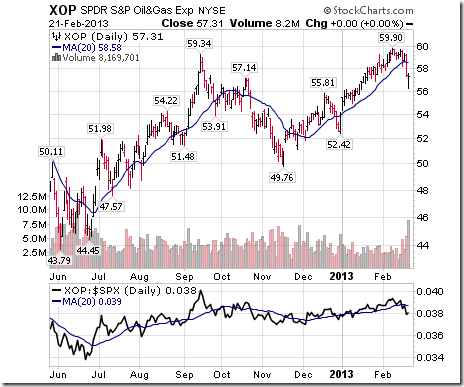
Technical score for U.S. Oil & Gas Exploration SPDRs changed from 3.0 to 1.0 when units fell below their 20 day MA and strength relative to the S&P 500 changed from positive to negative.
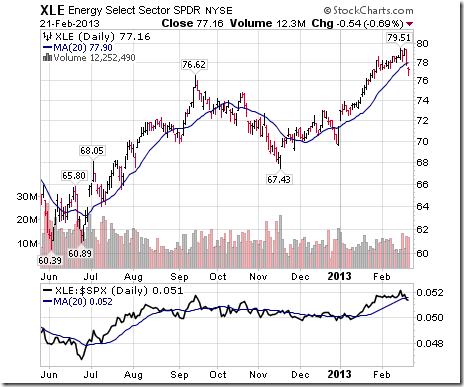
Technical score for Energy SPDRs changed from 3.0 to 1.0 after units fell below support at $77.07, dropped below its 20 day moving average and changed to neutral from positive relative to the S&P 500 Index. Seasonal influences are positive until the end of April
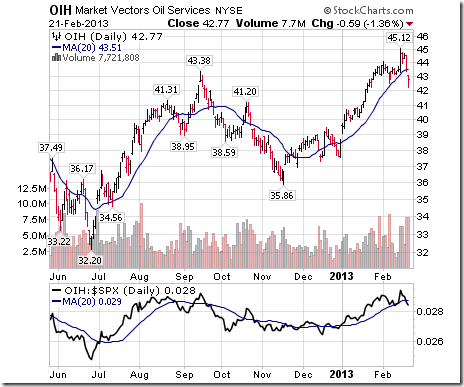
Technical score for Oil Services changed from 3.0 to 0.5 when units fell below their 20 day MA, dropped below support at $42.50 and changed relative performance from positive to negative.
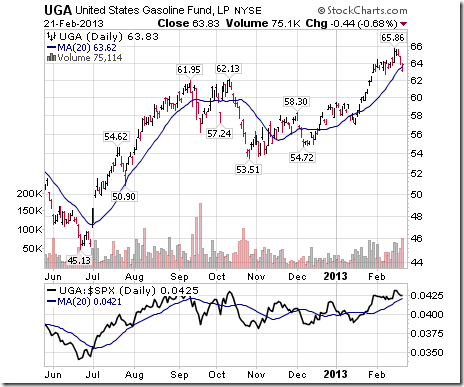
Technical score for Gasoline was unchanged at 3.0. Seasonal influences are positive until the end of April.
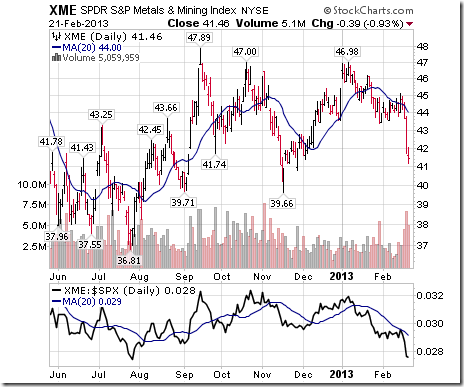
Technical score for Metals & Mining SPDRs changed from 3.0 to 0.0 on a break below its 20 day moving average, a break below support at $43.42 and a change in strength relative to the S&P 500 Index from positive to negative.
Eric Wheatley’s Listed Options Column
Good morning everyone,
After having spent the past few weeks on volatility and how to trade it (pssst, the VIX is at even more ridiculous historical lows. Buy options!), I had to dig for content. I remembered a post I made a couple weeks ago on a strange cartoon-alien website.
The original post follows (spelling and punctuation unchanged). The title was “Trying to wrap my head around AAPL options”:
“Please tell me if I am understanding this correctly. If I sell a jan ’15 510 call for $47 and buy a $300 call for $161 then my net cost would be $114. So my maximum loss would be $114 and my maximum profit $96. Even if the stock is flat till expiration that means I would profit $43.84 or better than 38%”.
I checked his numbers and they were reasonably close to what was available in the market at the close.
He was describing a bull call spread. The 300 call was very deeply in-the-money and the 510 call had some very good time value, which netted out to a reasonably nice position. I’ve often mentioned that deep in-the-money calls work well as a stock proxy – in that they are less expensive than buying the shares outright, yet they will shadow the stock’s price – so in this case, the spread resembles a covered call, but with lower risk.
The stock was, at the time, at $457.84. This meant that the 300 call, which he would own, had an intrinsic value of $157.84. Subtracting the amount paid for the position, it would indeed be up by $43.84 at the outset. If the stock had risen, he would gain from a parallel rise in the price of his long call. If the stock’s price were to drop, he had a $43.84 cushion before losing any money. Neophytes would look at this and figure that it’s too good to be true.
This illustrates a fundamental aspect to options: High-delta in-the-money options have very little time value. This means that you can buy a two-year stock proxy for just over a third of the price of the stock. Sell a juicy out-of-the-money option which has plenty of time value, and you’re well-positioned – much as with a covered call – for a good return.
The downside to the position is that in-the-money options are inherently illiquid. Few people ever trade them, so the market-maker’s bid-ask spread will be wide. As the person who will take the counterparty to the trade, the market-maker will be able to hedge off the sale of the in-the-money call easily by buying the stock and pocketing the spread received on the option. The out-of-the-money call is purchased and hedged off dynamically (as we have seen in detail last week). All in all, it’s a good trade for both parties, though a LOT can happen in two years with a post-Jobs Apple.
On that note, my presence on this site next week isn’t entirely certain. Negotiations are underway for a vacation with friends. If I’m not here, I’ll be back in two weeks.
Cheers!
Éric Wheatley, MBA, CIM
Associate Portfolio Manager, J.C. Hood Investment Counsel Inc.
eric@jchood.com
514.604.2829; 1.855.348.2829
*****************
Little known fact about John Charles Hood #62
John Charles Hood, luckily, is unaware of the existence of alien-logo’d websites and doesn’t inquire about my doing “research” there.
Special Free Services available through www.equityclock.com
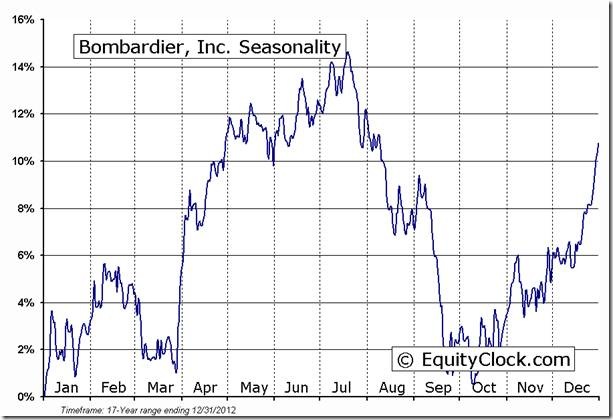
Equityclock.com is offering free access to a data base showing seasonal studies on individual stocks and sectors. The data base holds seasonality studies on over 1000 big and moderate cap securities and indices. Notice the recent update on most charts.
To login, simply go to http://www.equityclock.com/charts/
Bombardier, Inc. (TSE:BBD.B) Seasonal Chart
Disclaimer: Comments and opinions offered in this report at www.timingthemarket.ca are for information only. They should not be considered as advice to purchase or to sell mentioned securities. Data offered in this report is believed to be accurate, but is not guaranteed.
Don and Jon Vialoux are research analysts for Horizons Investment Management Inc. All of the views expressed herein are the personal views of the authors and are not necessarily the views of Horizons Investment Management Inc., although any of the recommendations found herein may be reflected in positions or transactions in the various client portfolios managed by Horizons Investment Management Inc
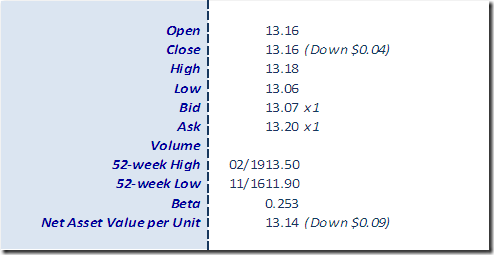
Horizons Seasonal Rotation ETF HAC February 21st 2013
Copyright © Tech Talk


![clip_image001[1] clip_image001[1]](https://advisoranalyst.com/wp-content/uploads/HLIC/62f0a54833712b24dd030bda0ff3c5cb.png)
