When Politics Trump Economics
The U.S. economic expansion continues, but increasing attention to political risks, and currency wars, in particular, indicate a period of heightened volatility could be ahead.
by Scott Minerd, CIO, Guggenheim Partners LLC
Virtually every recent data release indicates that the United States is in a sustained economic expansion. From the positive underlying strength in fourth quarter 2012 GDP, to stronger housing, falling unemployment, and increasing state and local tax receipts, there is hardly a gray cloud in the sky. Importantly, however, there is a sea change underway in the markets. We are transitioning from the environment of the last five years in which the market digested and reacted to macroeconomic results to one that will be increasingly dominated by politics and political risk.
Given the range and scope of programs being pursued by policymakers around the world, investors will have to focus more on the agendas of nations and their central banks. Europe’s ongoing structural issues and the looming fiscal uncertainty in the U.S. are unsettling, however, the most overt manifestation of the shift that’s underway is the threat of global currency wars. Tuesday’s comments by the G7 on the adverse economic and financial implications of competitive devaluation, combined with the United States’ comments that Japan is likely pursuing the right policy by seeking to combat deflation, highlight the contradictory nature of the geo-political climate. All the while, Japan’s aggressive monetary accommodation is becoming more worrying for leaders in the European Union, who are concerned about the consequences of the euro’s rapid increase in value. The net effect of all this opportunistic policy activity and disagreement will likely be heightened volatility as we head further into the year.
Economic Data Releases
Shrinking Trade Deficit Could Turn GDP Revision Positive
• The December trade deficit shrank to the lowest level since January 2010, as exports gained 2.1% and imports fell 2.7%. The shrinking gap was supported by a record-low volume of oil imports and record-high petroleum exports.
• Wholesale inventories unexpectedly shrank in December by 0.1%, the first decrease since June.
• Fourth quarter productivity of non-farm workers declined at a 2% annualized rate, the most since the first quarter of 2011. The fall in productivity pushed unit labor costs up by 4.5%.
• Unemployment applications fell by 5,000 to 366,000 for the week ended February 2nd. Continuing claims also rose more than expected.
• The NFIB Small Business Optimism Index rebounded slightly to 88.9 in January, failing to regain losses caused by Fiscal Cliff uncertainty.
• Job openings in the U.S. fell from the November four-year high of 3.79 million to 3.62 million in December.
Industrial Production Up in Germany, Italy, and U.K.
• German factory orders rose 0.8% in December, after falling the prior month. Industrial production increased for the first time in five months, rising 0.3% in January. German exports did not meet expectations, growing only 0.3% in December.
• French industrial production fell 0.1% in December, after gaining 0.5% in November, while the U.K. and Italy both increased production from a month earlier. Industrial production in all three countries remained lower on a year-over-year basis.
• House prices in the U.K. fell 0.2% in January, the first drop since October.
• Both the European Central Bank and the Bank of England left their benchmark interest rates unchanged at 0.75% and 0.5%, respectively.
• China’s January exports grew 25.0% from a year earlier, the biggest increase since April 2011, as the trade surplus fell less-than-expected to $29.15 billion.
Chart of the Week
Rising Inflation Expectations in Japan
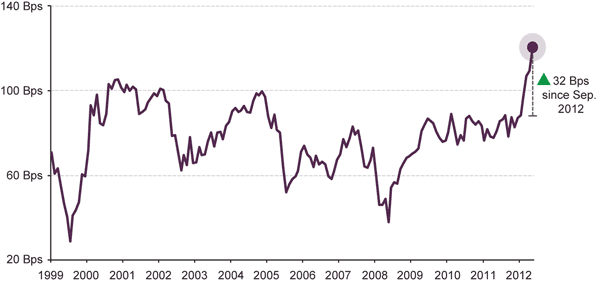
The Bank of Japan’s (BoJ) effort to reflate the Japanese economy has elevated the bond market’s inflation expectations. Japanese swap rates, which gauge market expectations on future interest rates, have moved dramatically over the past few months in response to the BoJ’s policies. Most noticeably, the spread between the 30-year swap rate and the 10-year swap rate has widened from 88 basis points in September 2012 to 120 basis points in January 2013, reaching the highest level since data began in 1999. The widening spread suggests that investors are expecting a rising inflation rate in the future and are liquidating their holdings of long-term securities to reduce their duration risk.
JAPANESE YIELD CURVE - SPREAD BETWEEN 30-YEAR SWAP RATE AND 10-YEAR SWAP RATE

Source: Bloomberg, Guggenheim Investments. Data as of 1/31/2013.
This article is distributed for informational purposes only and should not be considered as investing advice or a recommendation of any particular security, strategy or investment product. This article contains opinions of the author but not necessarily those of Guggenheim Partners or its subsidiaries. The author’s opinions are subject to change without notice. Forward looking statements, estimates, and certain information contained herein are based upon proprietary and non-proprietary research and other sources. Information contained herein has been obtained from sources believed to be reliable, but are not assured as to accuracy. No part of this article may be reproduced in any form, or referred to in any other publication, without express written permission of Guggenheim Partners, LLC. ©2013, Guggenheim Partners. Past performance is not indicative of future results. There is neither representation nor warranty as to the current accuracy of, nor liability for, decisions based on such information.
Copyright © Guggenheim Partners LLC


